📝How to Discover Prometheus Endpoints Using DNS in OpenShift 🚀
If you're running a project on OpenShift and want to integrate monitoring with Prometheus, a critical first step is locating your Prometheus endpoints. Sometimes, especially in dynamic environments, you’ll need to do this using DNS. Let's walk through the steps to find these endpoints effortlessly! 🌐
🚀 Step-by-Step Guide
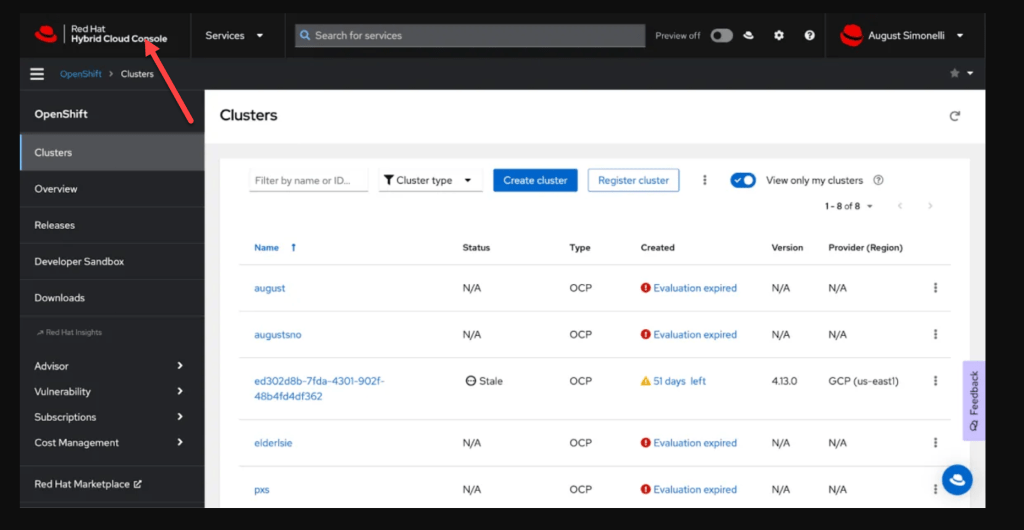
- 💡 Start with the OpenShift Console
Begin by accessing the OpenShift Web Console. This console is your main interface, and from here, you can manage all your resources, including Prometheus.
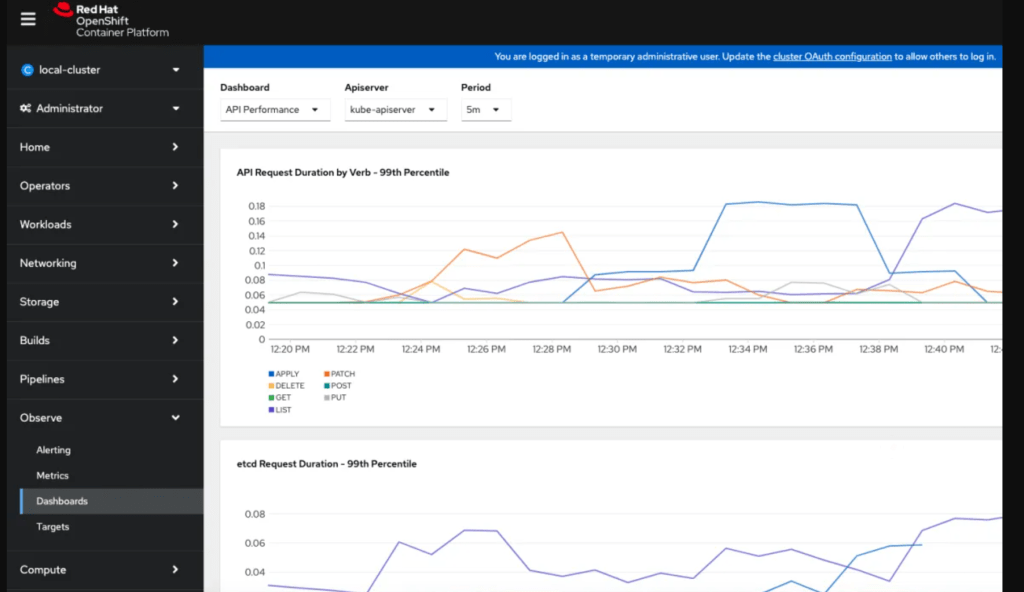
- 🔍 Check the Prometheus Operator
Navigate to the namespace where your Prometheus Operator is installed. In many cases, this isopenshift-monitoringor a custom namespace you defined during setup.
-
⚙️ Look for Service Discovery
Within your Prometheus instance configuration, locate theServiceMonitorandPodMonitorresources. These resources define which services and pods Prometheus will monitor, and typically, they include DNS entries. -
Access these resources by running:
oc get servicemonitor -n <namespace> oc get podmonitor -n <namespace> -
📝 Note: Replace
<namespace>with your actual namespace.
🖥️ Screenshot Pause: Display a terminal showing oc get servicemonitor and oc get podmonitor commands.
-
🌐 View DNS Entries in ServiceMonitor Config ***
In eachServiceMonitororPodMonitordefinition, look for the DNS entry that specifies the target endpoint. These entries often look like: -
endpoints:
- target:
dnsName: "prometheus..svc.cluster.local"
- target:
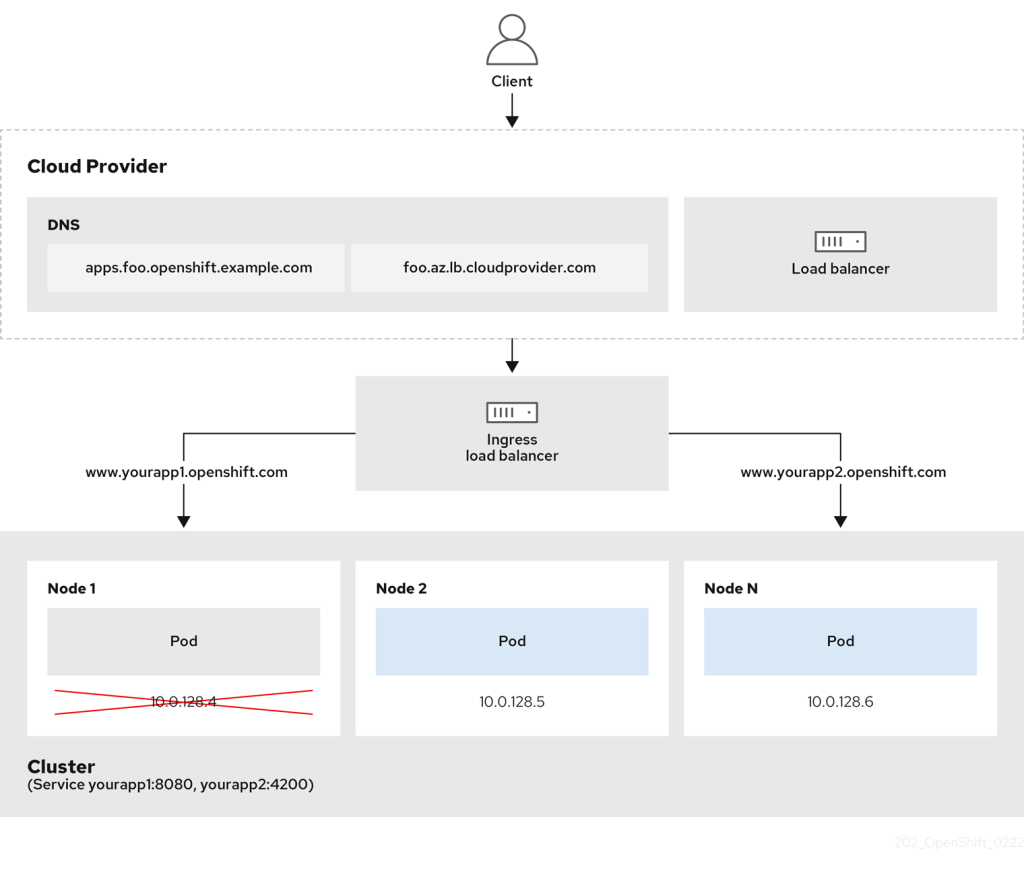
Multi loadbalancers
- 📡 Verify Endpoint Availability
Use thecurlcommand from within the OpenShift cluster to test these endpoints. For example:
oc exec -it
- Replace
<pod-name>with the name of a pod that has network access to the Prometheus service.
🖥️ Screenshot Pause: Show a terminal with a successful curl response to the DNS endpoint.
- 🔗 Integrate DNS-Based Endpoints in Prometheus Config
Now that you have the DNS entries, update your Prometheus configuration (if needed) to ensure these endpoints are part of your scrape config. Your Prometheus Operator should now handle these dynamically, keeping your configuration flexible and scalable.
🎉 Wrap-Up
Using DNS entries to locate Prometheus endpoints in OpenShift helps maintain robust monitoring in a dynamic environment. With these steps, you’ll be ready to keep an eye on all critical metrics and ensure seamless observability!
🔗 Connect with me:
Happy monitoring! 📊
Imported from rifaterdemsahin.com · 2025