Grafana Project
Creating a development project with Grafana that you can submit to GitHub and gain hands-on skills in saving and managing JSON files for dashboards is a great way to deepen your understanding of both Grafana and version control. Here’s a step-by-step guide on how to create such a project:
Project Overview
The project will involve setting up a Grafana instance, creating custom dashboards, exporting these dashboards as JSON files, and managing these files using Git. Finally, you will upload the project to GitHub. The project will also include documentation to explain the setup, the purpose of each dashboard, and instructions on how to restore them.
Steps to Complete the Project
1. Set Up a Grafana Instance
- Install Grafana:
You can either install Grafana locally on your machine or use Docker.
-
To install Grafana using Docker, you can use the following command:
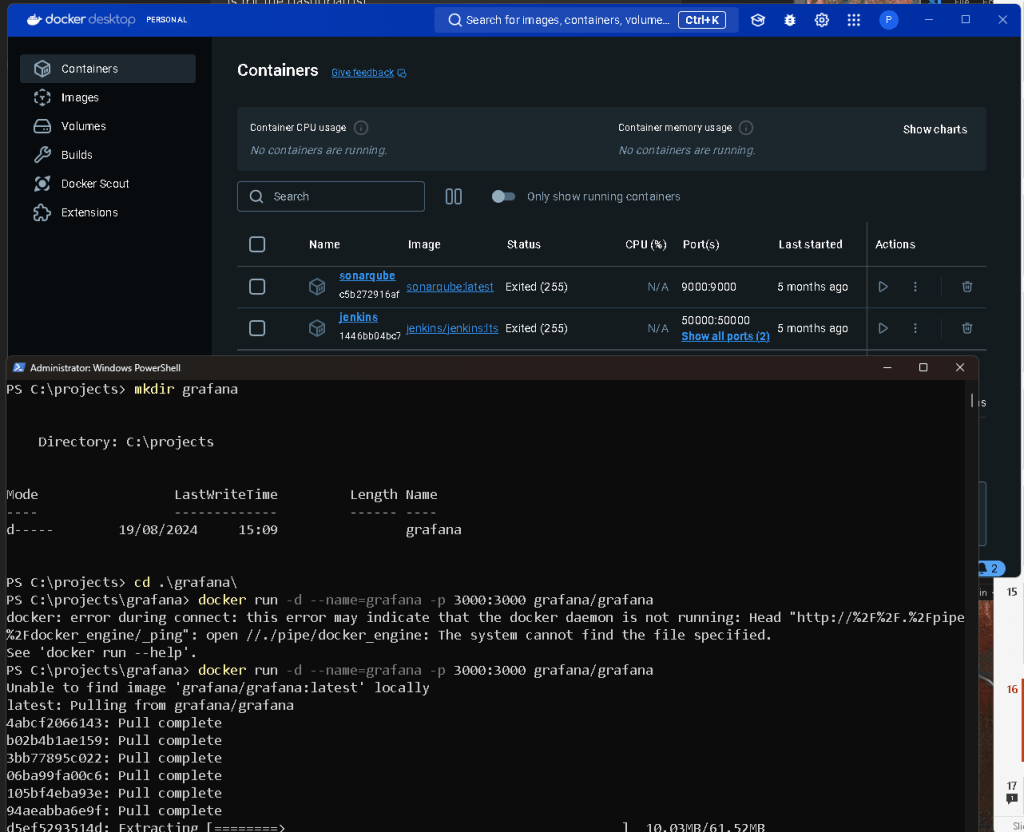
bash docker run -d --name=grafana -p 3000:3000 grafana/grafana -
Alternatively, follow the Grafana installation guide for your operating system.
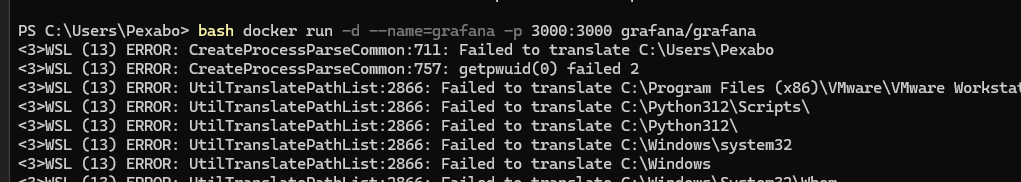
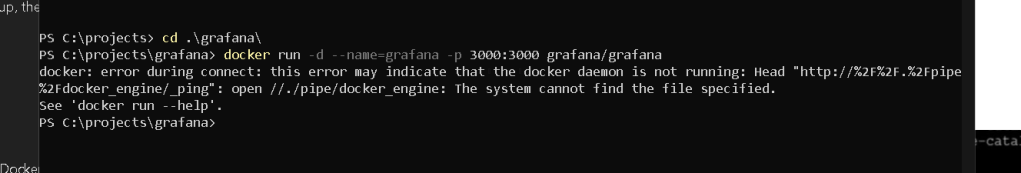
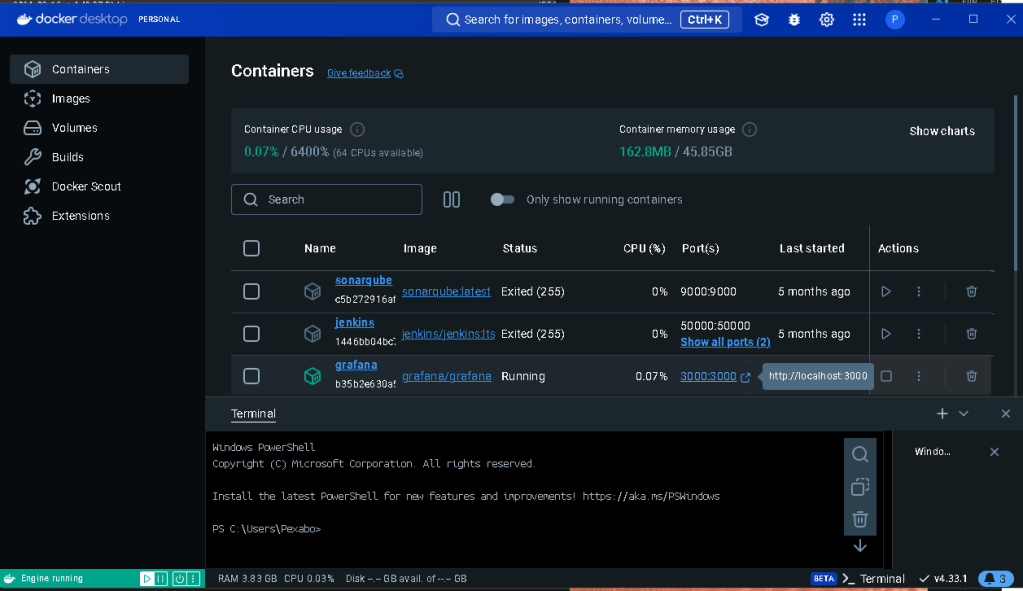
windows and docker enter
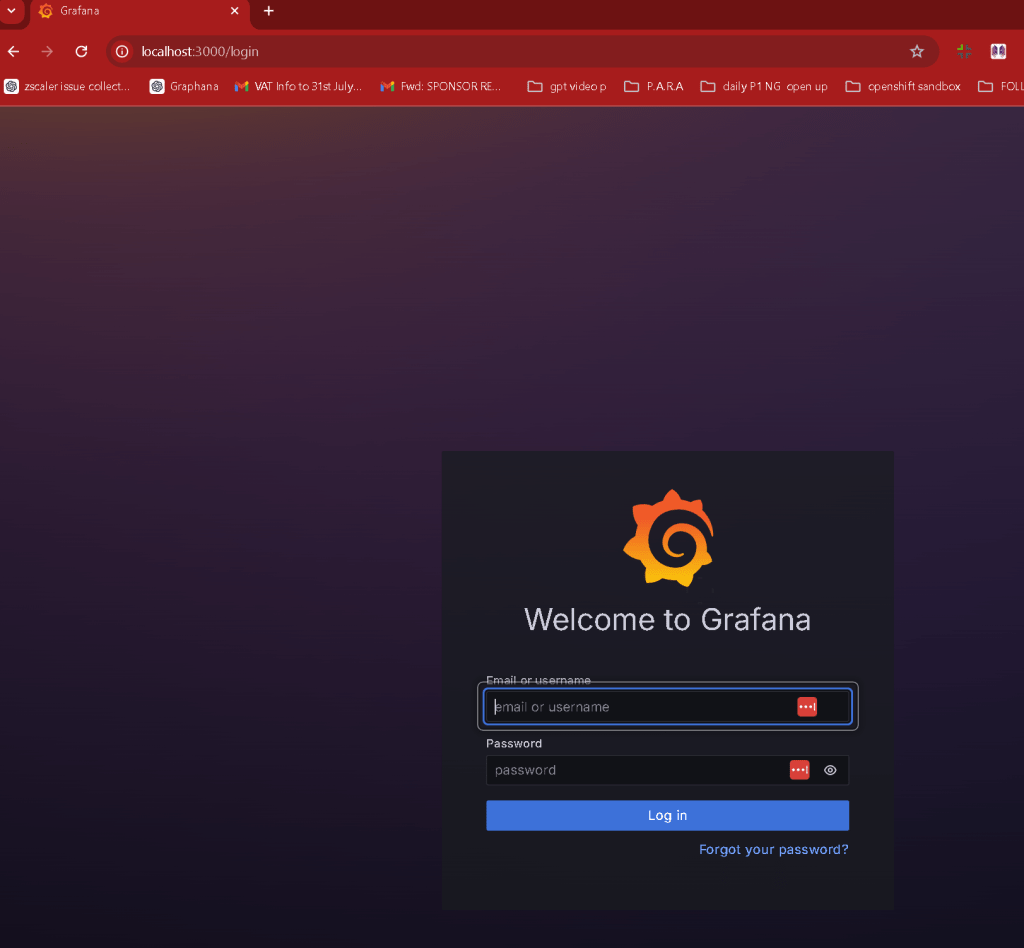
- Access Grafana:
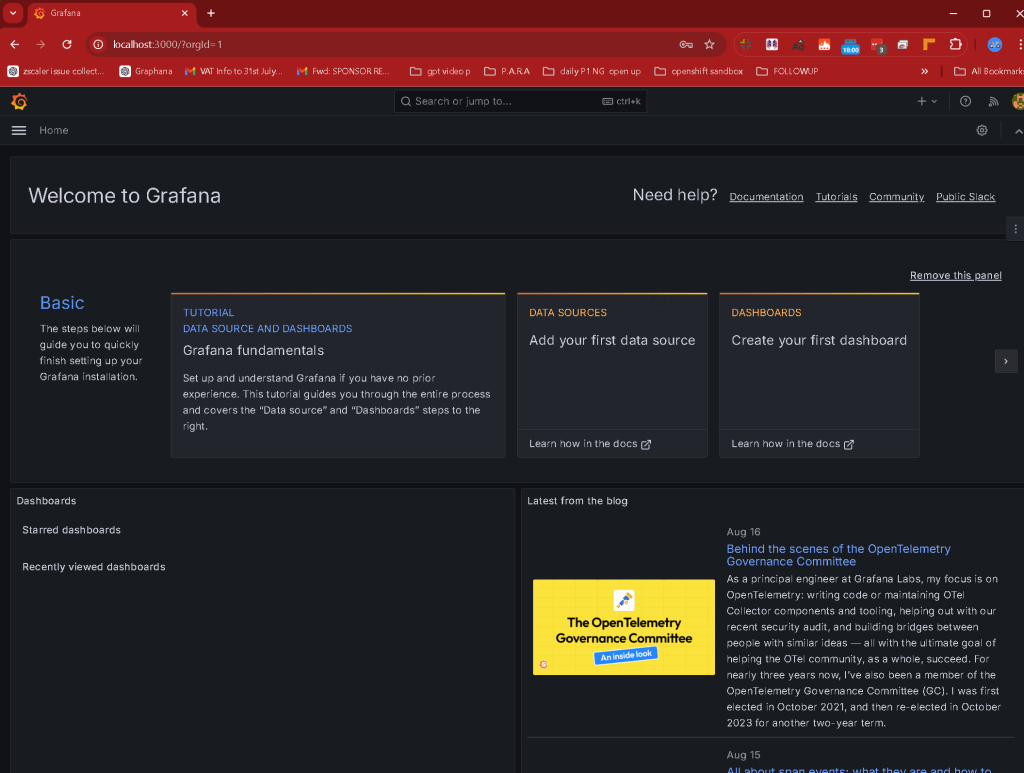
Once installed, you can access Grafana by navigating to http://localhost:3000 in your web browser.
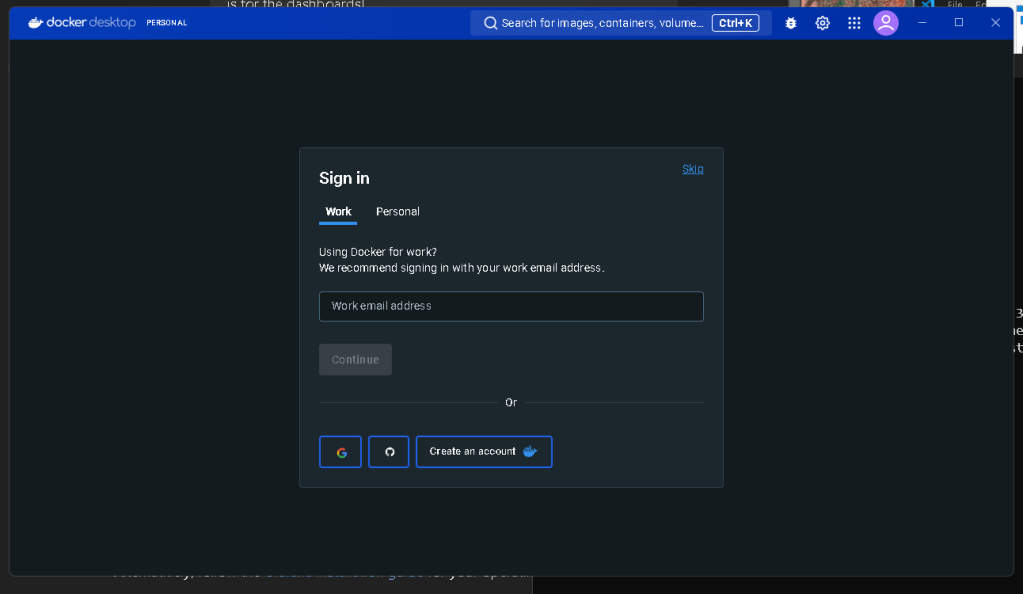
power of docker and images
- Create Dashboards
- Create Sample Data Sources:
Set up one or more data sources in Grafana. For example, you can use the built-in Graphite, Prometheus, or even a simple JSON data source.
Setting up data sources in Grafana is a crucial step for visualizing data. Here, I'll guide you through setting up two common data sources: Prometheus and a simple JSON data source. I'll also provide an overview of setting up Graphite.
1. Setting Up Prometheus as a Data Source
Step 1: Install and Start Prometheus
-
If you don't have Prometheus installed, you can download it from the Prometheus website.
-
Start Prometheus by running the following command in the directory where Prometheus is installed:
./prometheus --config.file=prometheus.yml
- Prometheus should now be running on
http://localhost:9090.
Step 2: Add Prometheus as a Data Source in Grafana
-
Open Grafana in your web browser (
http://localhost:3000). -
Log in using your credentials.
-
Navigate to Configuration > Data Sources from the left-hand sidebar.
-
Click on Add data source.
-
Select Prometheus from the list of available data sources.
-
Configure the following settings:
-
URL:
http://localhost:9090(assuming Prometheus is running locally). -
Other settings can be left at their default values.
-
Click Save & Test to verify the connection.
Grafana should confirm that the data source was successfully added.
2. Setting Up a JSON Data Source
To use a JSON data source, you can either set up a simple JSON API or use existing JSON data.
Step 1: Install SimpleJson Data Source Plugin
-
Grafana doesn’t support JSON as a built-in data source, so you need to install the SimpleJson plugin.
-
Run the following command to install it:
grafana-cli plugins install grafana-simple-json-datasource
- Restart Grafana to load the new plugin:
sudo service grafana-server restart
Step 2: Add JSON Data Source in Grafana
-
In Grafana, go to Configuration > Data Sources.
-
Click on Add data source.
-
Search for and select SimpleJson.
-
Configure the JSON data source:
-
URL: Enter the URL of your JSON API. If you're using a local server, it might look something like
http://localhost:5000. -
Additional settings can be configured based on your JSON structure and requirements.
-
Click Save & Test to verify the connection.
3. Setting Up Graphite as a Data Source
Step 1: Install and Start Graphite
- If you haven’t installed Graphite, you can do so using the following commands (assuming Ubuntu/Debian):
sudo apt-get install graphite-web graphite-carbon
sudo apt-get install libapache2-mod-wsgi
- Configure Graphite and Carbon as per the documentation, then start the services.
Step 2: Add Graphite as a Data Source in Grafana
-
In Grafana, go to Configuration > Data Sources.
-
Click Add data source.
-
Select Graphite.
-
Configure the following:
-
URL: The default for Graphite running locally is usually
http://localhost:8080. -
Leave other settings at their default unless you have a specific configuration.
-
Click Save & Test.
Conclusion
Once you have set up one or more of these data sources, you can start creating dashboards and panels that query and visualize data from Prometheus, JSON, or Graphite. This setup will allow you to practice interacting with real-time data and integrating different data sources into Grafana, which is essential for building comprehensive monitoring solutions.
- Design Dashboards:
Create multiple dashboards with different panels (graphs, tables, alerts, etc.). These should demonstrate a range of Grafana’s visualization capabilities.
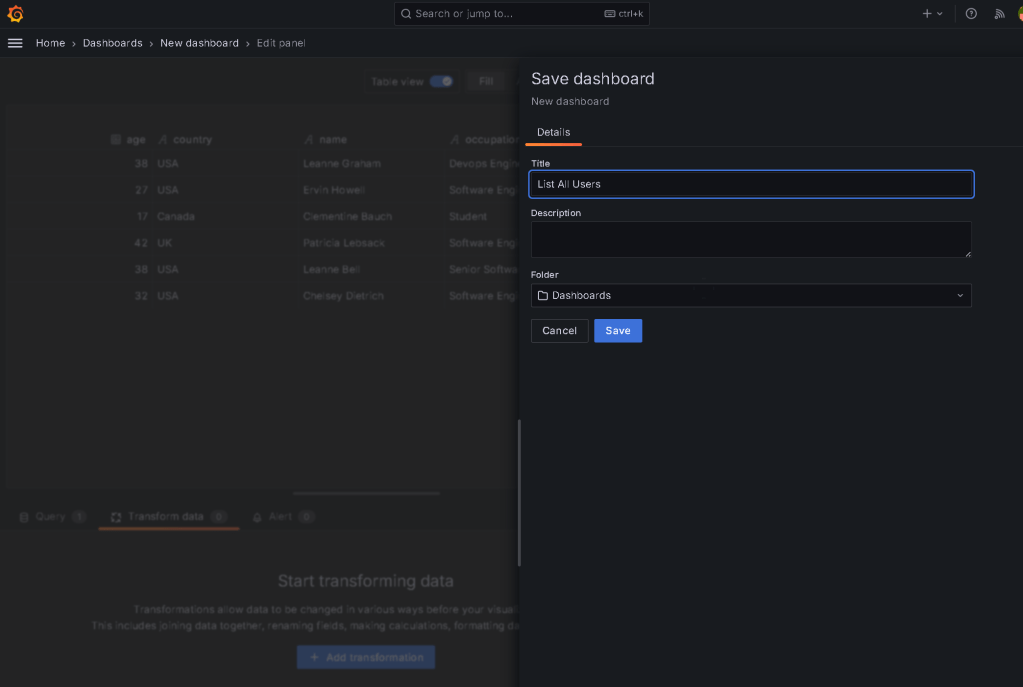
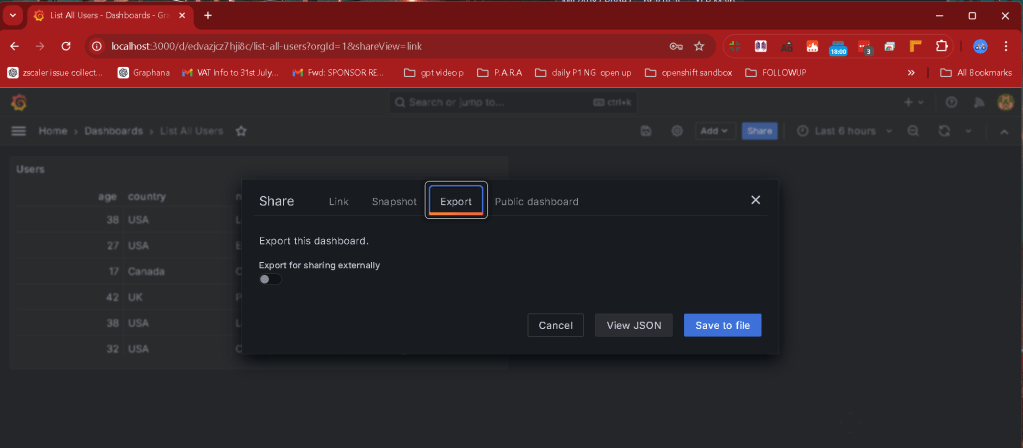
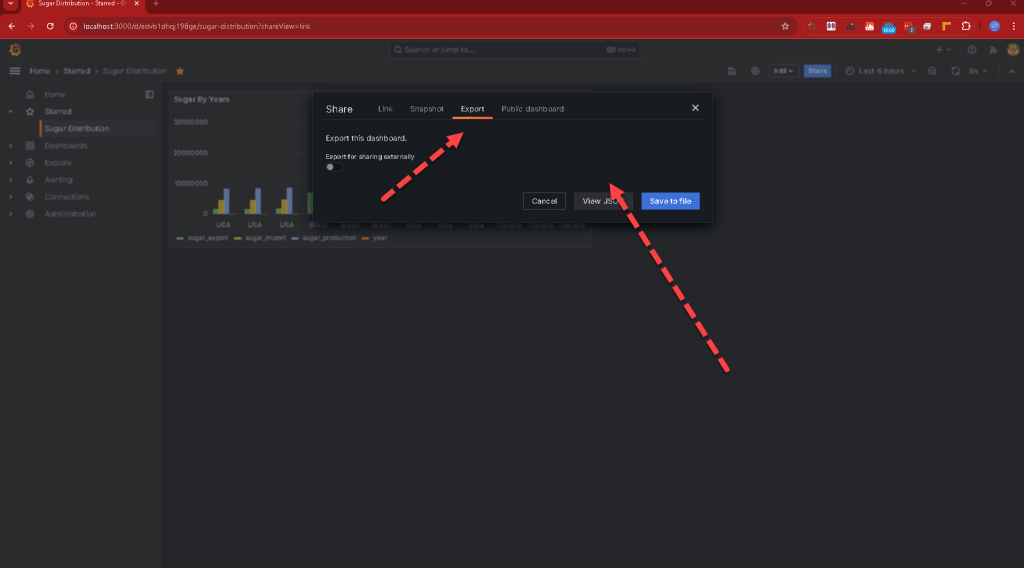
- Export Dashboards as JSON:
After creating a dashboard, go to the dashboard settings, and select the "JSON Model" option. Click on "Export" to download the JSON file representing the dashboard.
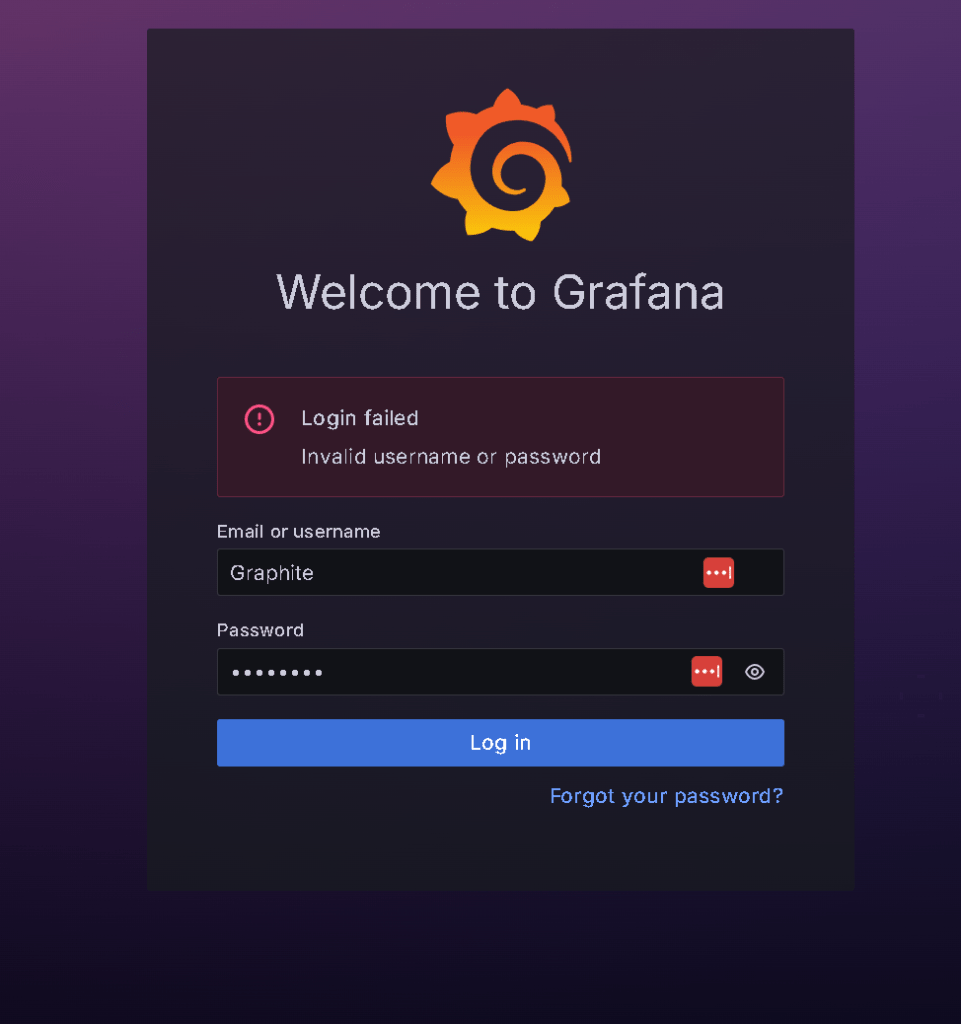
The default username for Grafana is usually:
-
Username:
admin -
Password:
admin
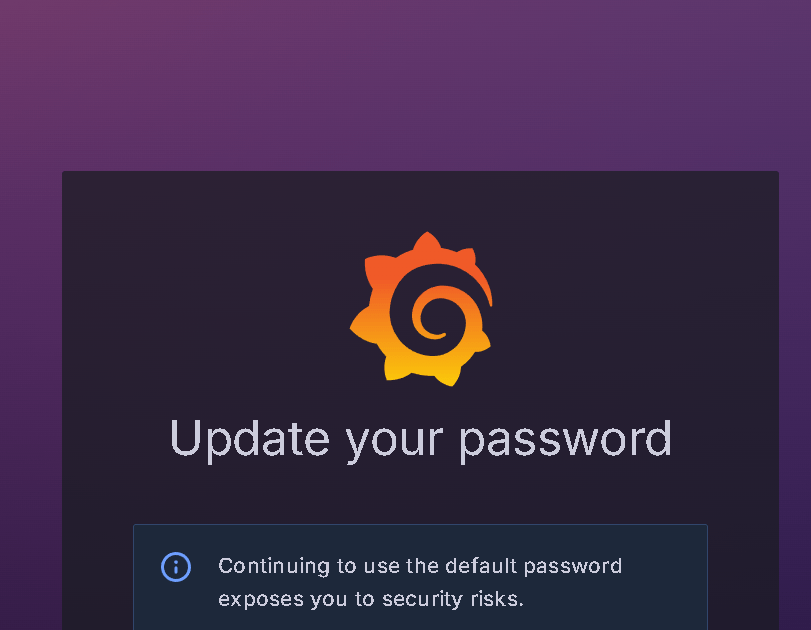
Upon first login, Grafana will prompt you to change the password. If you're using a pre-configured setup or a cloud instance, the default credentials might be different, so it's always good to check any provided documentation for specific setups.
Setting up a simple JSON data source in Grafana involves creating a backend service that serves JSON data and then configuring Grafana to use this data via the SimpleJson plugin. Below are the steps to set this up:
Step 1: Install the SimpleJson Data Source Plugin
First, you need to install the SimpleJson plugin for Grafana, which allows you to use JSON data from a REST API as a data source.
-
Open a terminal on your machine where Grafana is installed.
-
Run the following command to install the SimpleJson data source plugin:
grafana-cli plugins install grafana-simple-json-datasource
- Restart the Grafana server to activate the plugin:
sudo systemctl restart grafana-server
Step 2: Set Up a Simple JSON API
Next, you need to create a simple web service that returns JSON data. For simplicity, we'll use Python with Flask to create this service.
- Install Flask:
pip install flask
- Create a Python script (
simple_json_api.py):
from flask import Flask, jsonify
app = Flask(name)
@app.route('/query', methods=['POST'])
def query():
data = {
"target": "sample_metric",
"datapoints": [
[100, 1622476800000],
[200, 1622480400000],
[300, 1622484000000],
]
}
return jsonify([data])
@app.route('/search', methods=['POST'])
def search():
return jsonify(["sample_metric"])
@app.route('/annotations', methods=['POST'])
def annotations():
return jsonify([])
if name == 'main':
app.run(host='0.0.0.0', port=5000)
- Run the Flask app:
python simple_json_api.py
This script sets up a simple JSON API that listens on port 5000. The /query endpoint returns a JSON response that simulates metric data.
Step 3: Configure the JSON Data Source in Grafana
-
Open Grafana in your web browser (
http://localhost:3000). -
Log in with your credentials.
-
Go to Configuration > Data Sources from the left sidebar.
-
Click on Add data source.
-
Search for SimpleJson and select it.
-
Configure the JSON data source:
-
Name: Enter a name for the data source, e.g.,
Simple JSON API. -
URL: Enter the URL of your Flask app, e.g.,
http://localhost:5000. -
Leave other settings at their default values.
-
Click Save & Test to verify the connection.
Step 4: Create a Dashboard in Grafana
-
Go to Dashboards > New Dashboard.
-
Click Add new panel.
-
In the Query section of the panel editor, select your Simple JSON data source.
-
Type
sample_metricin the metric field (this should match the metric returned by the/searchendpoint of your API). -
Adjust the time range as needed to ensure your data points are visible.
-
Customize the visualization options as you prefer.
-
Save the dashboard.
Conclusion
You now have a simple JSON data source set up in Grafana. This allows you to pull data from any REST API that returns JSON and visualize it in Grafana. The SimpleJson plugin makes it easy to integrate custom data sources, which is particularly useful for environments where you might need to visualize data from non-standard or custom-built APIs.
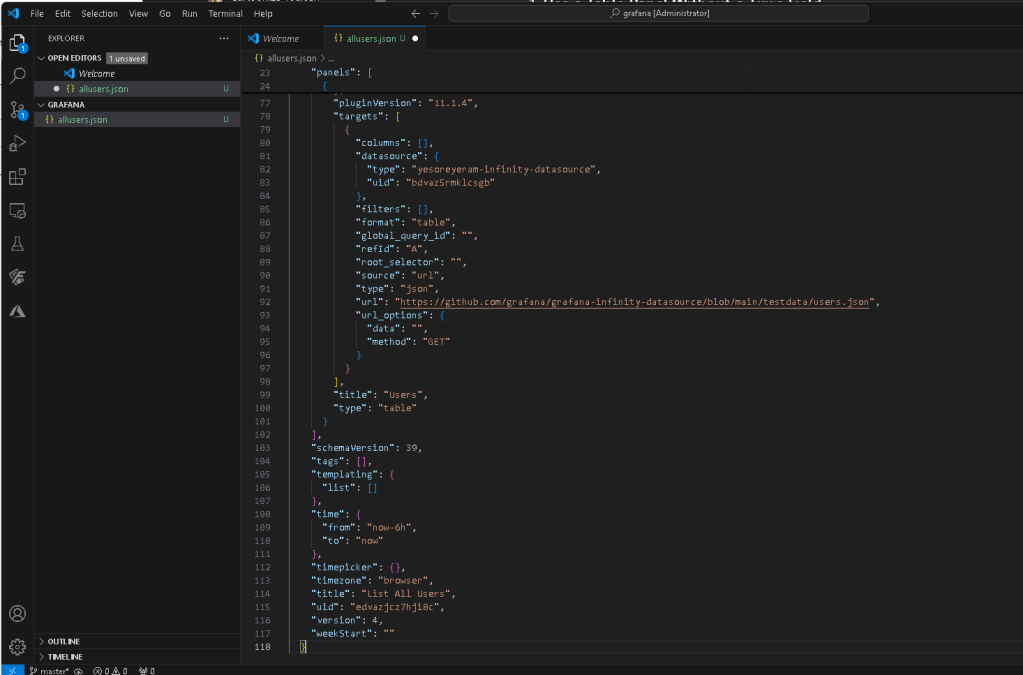
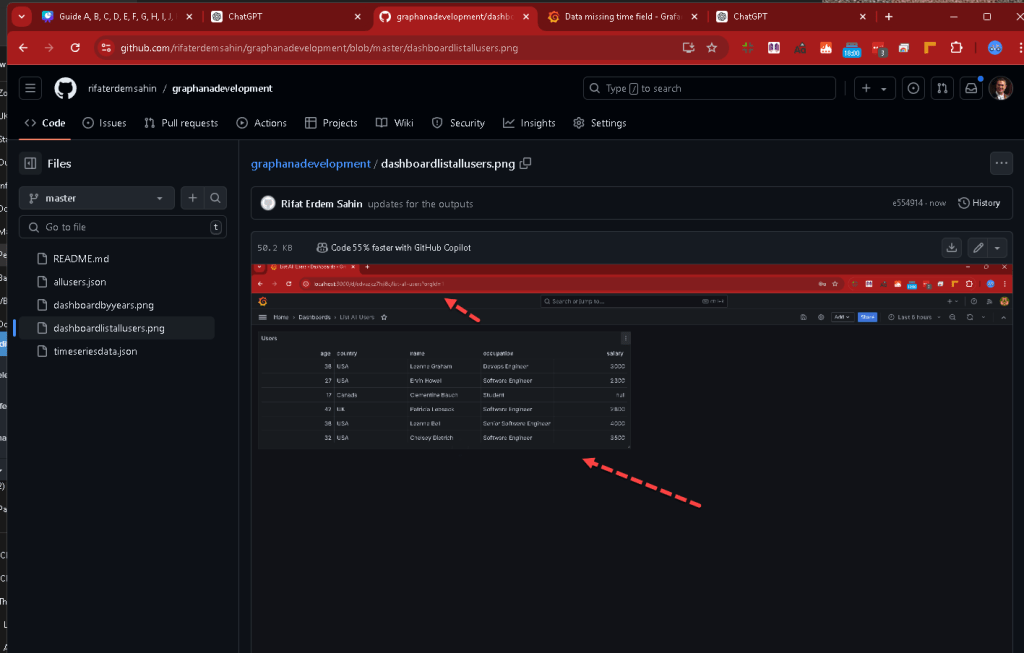
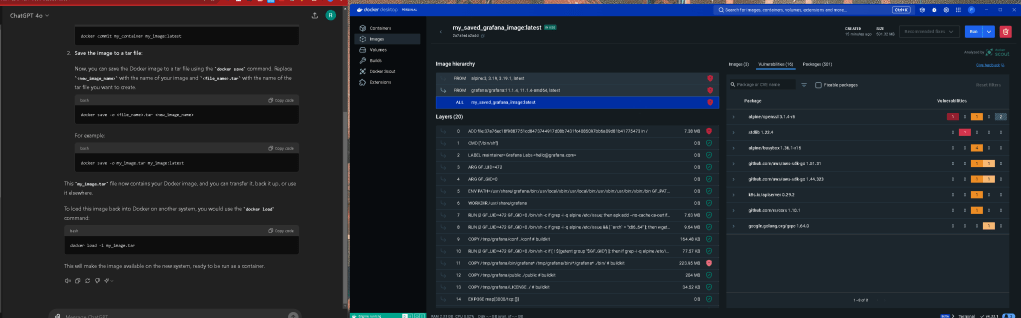
Plugins
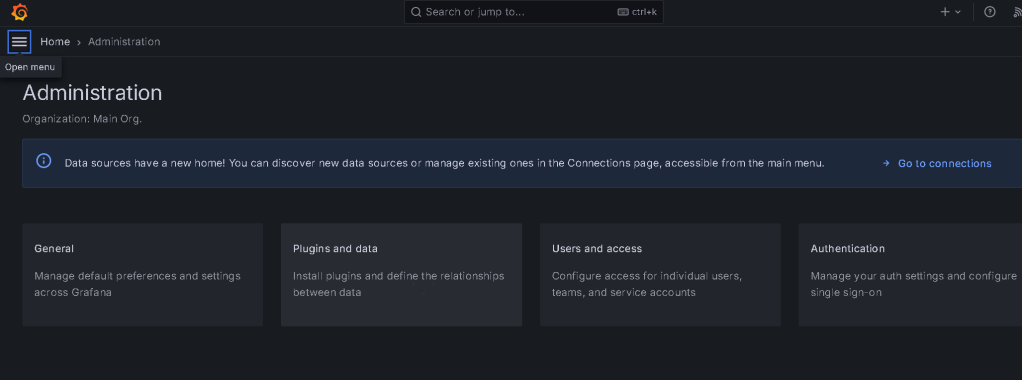
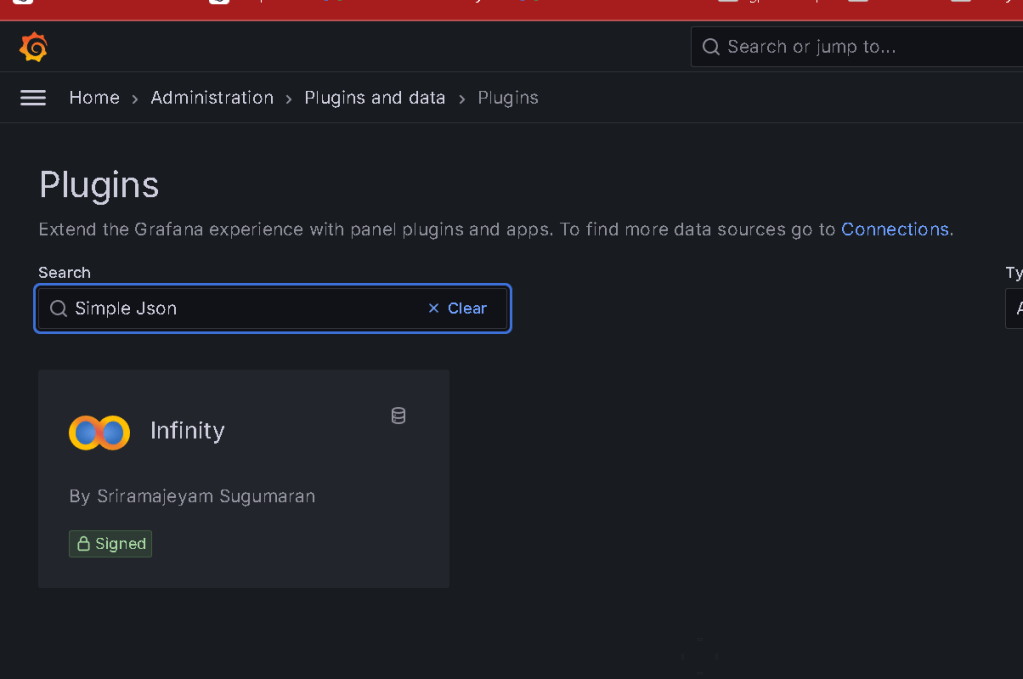
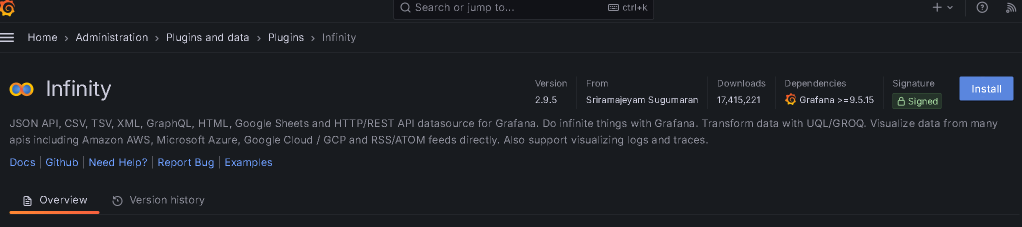
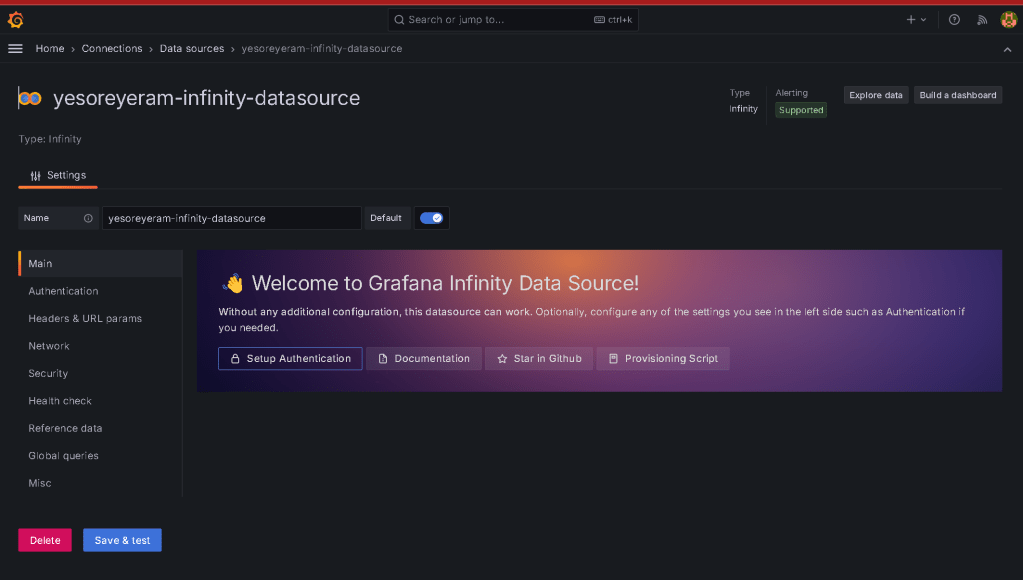
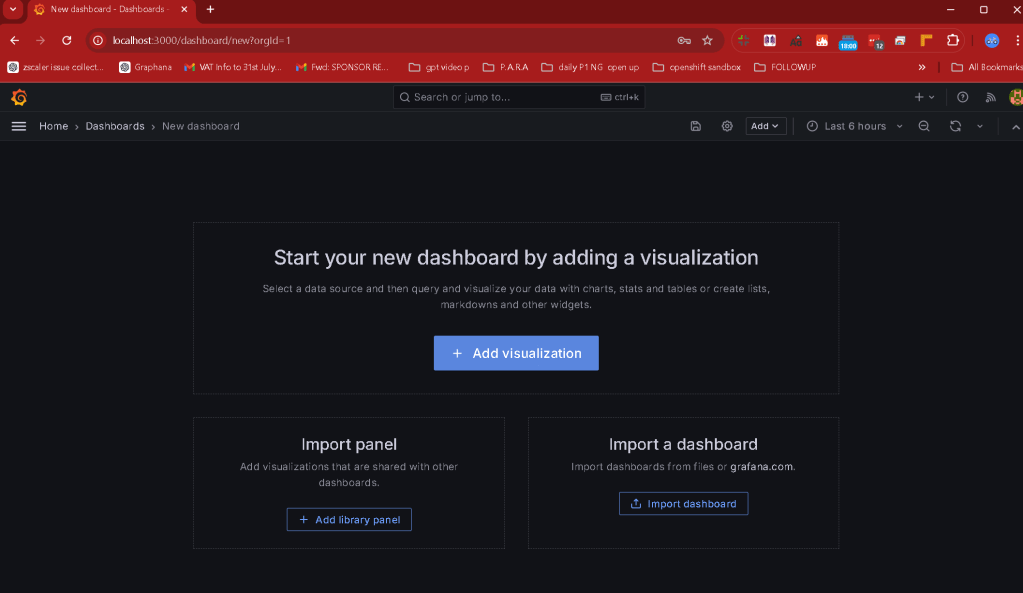
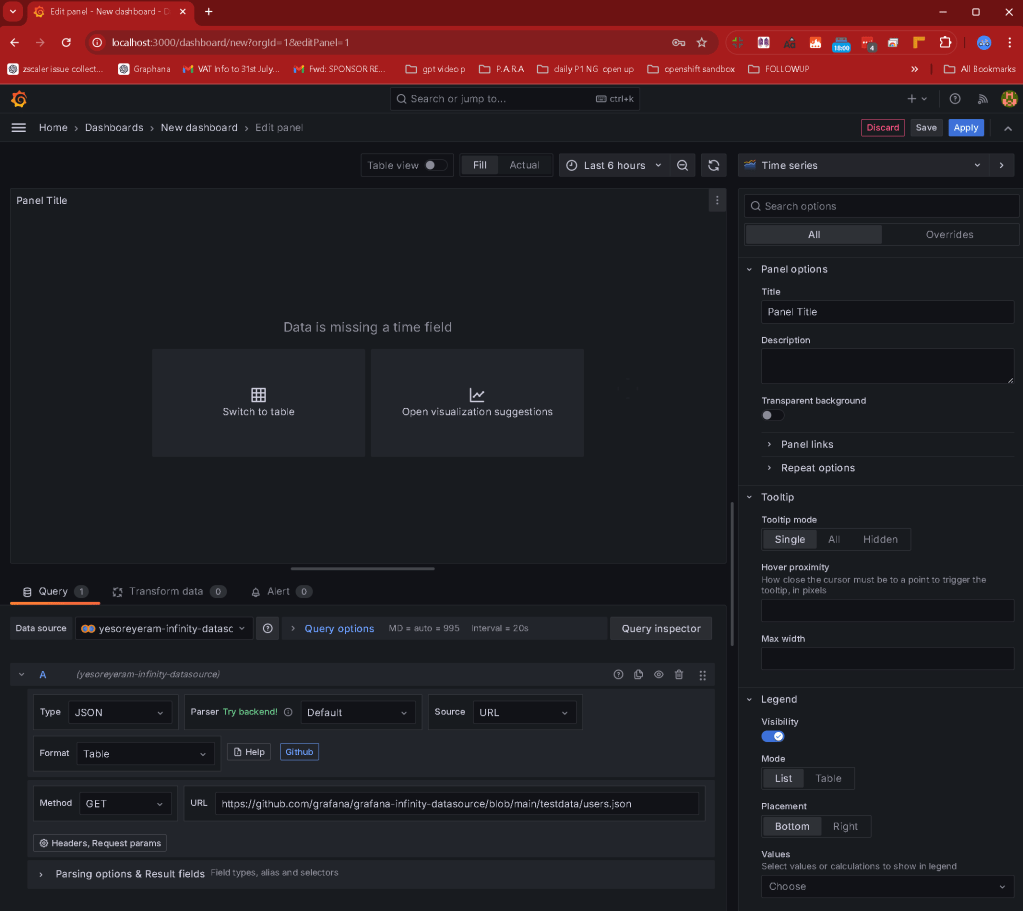
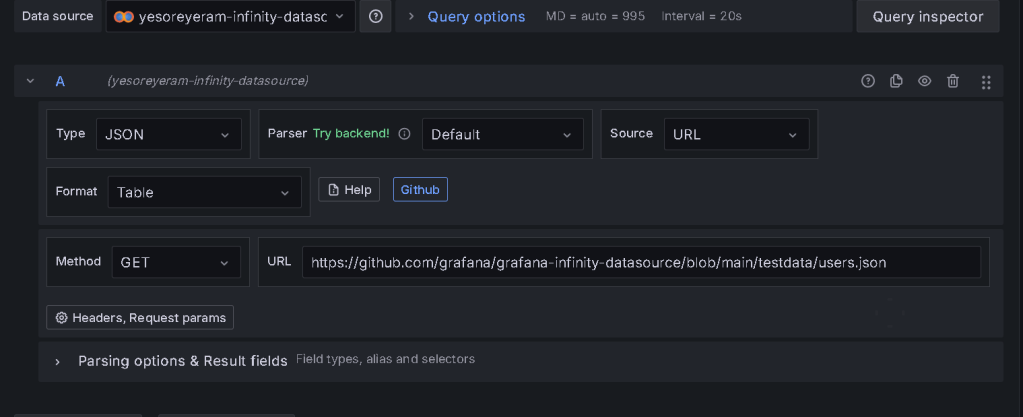
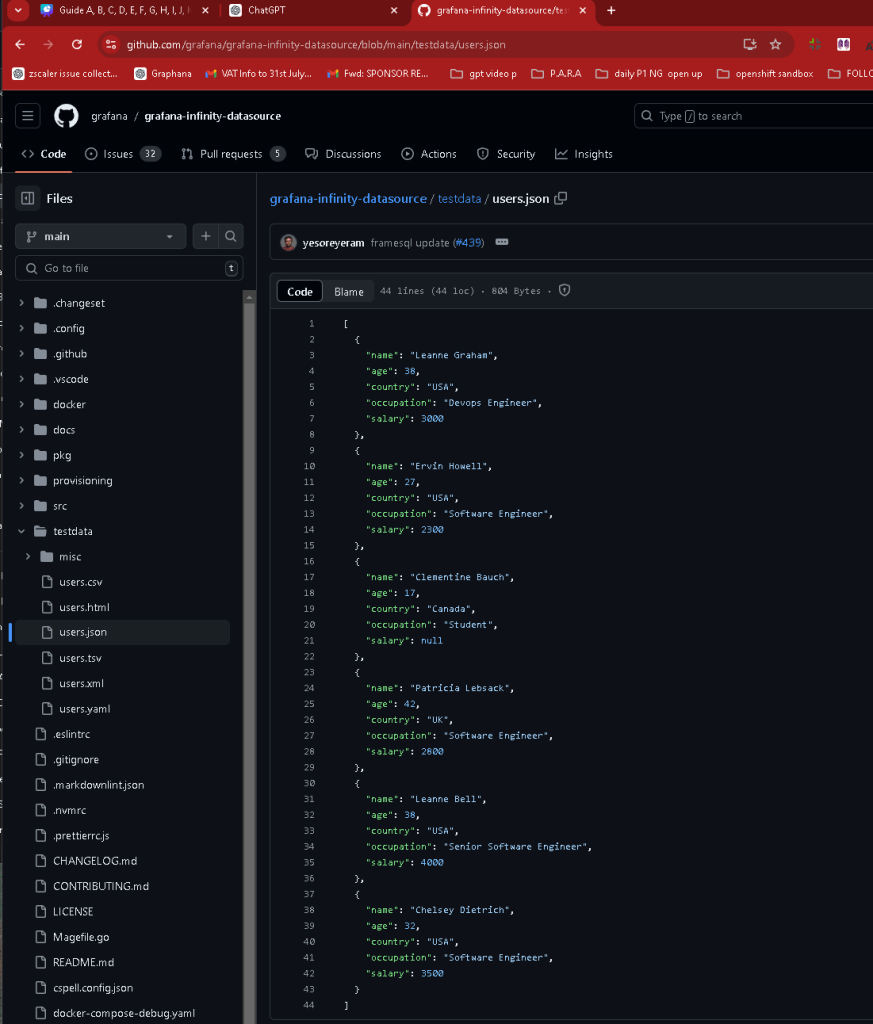
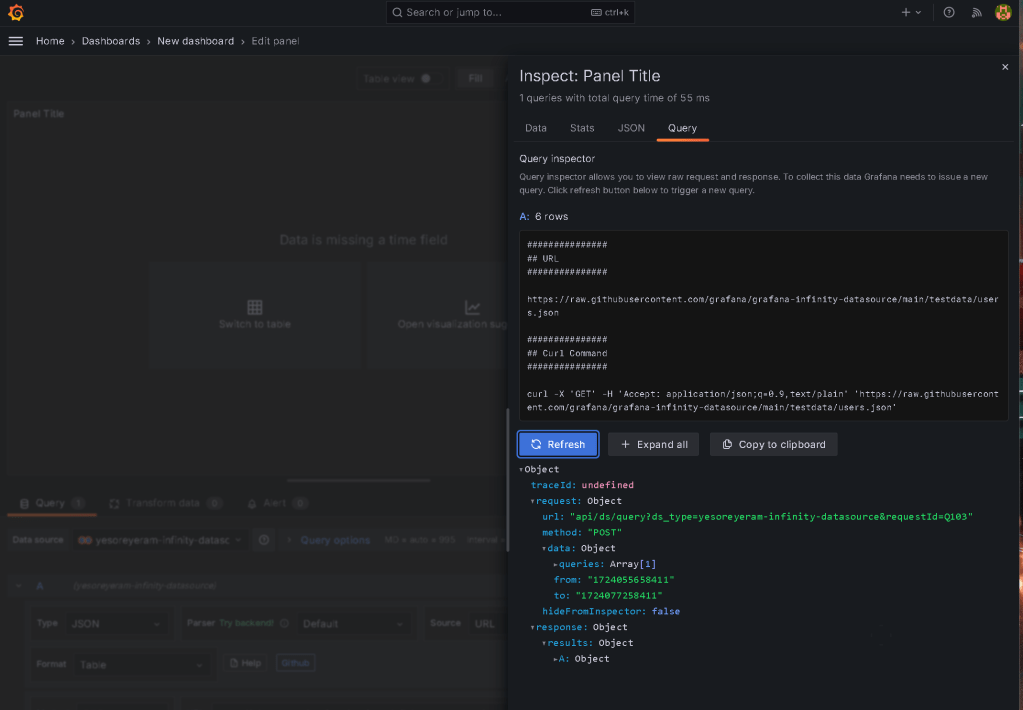
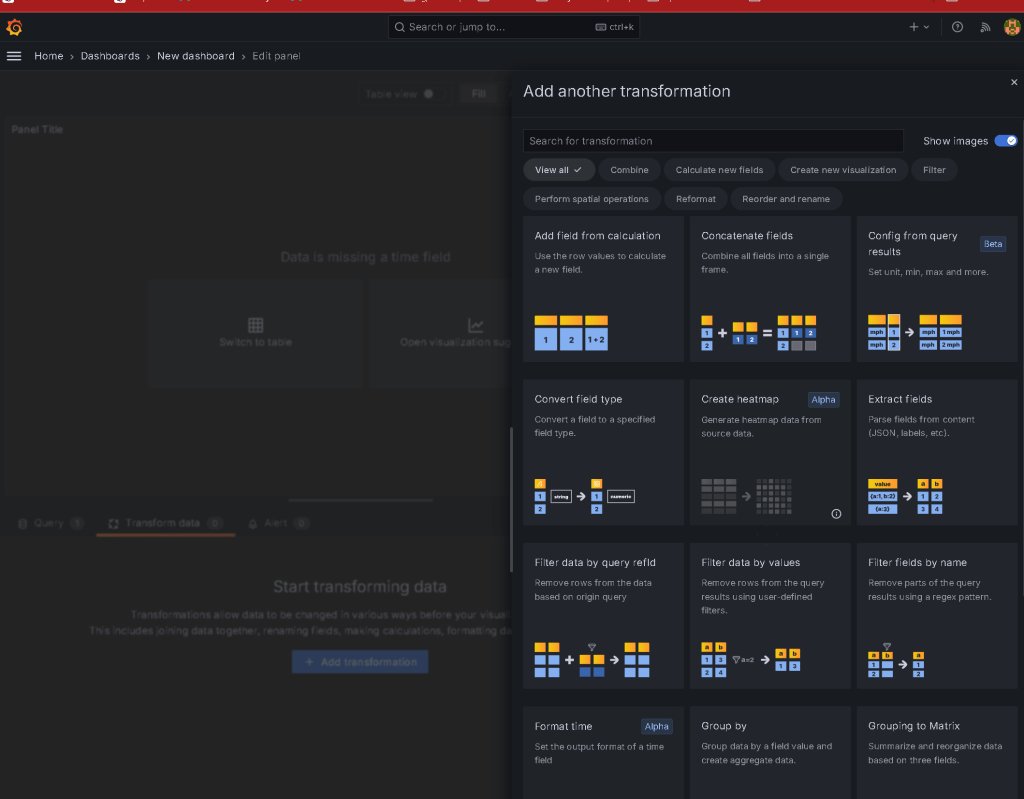
Table view
https://github.com/grafana/grafana-infinity-datasource/blob/main/testdata/users.json
Select table over there
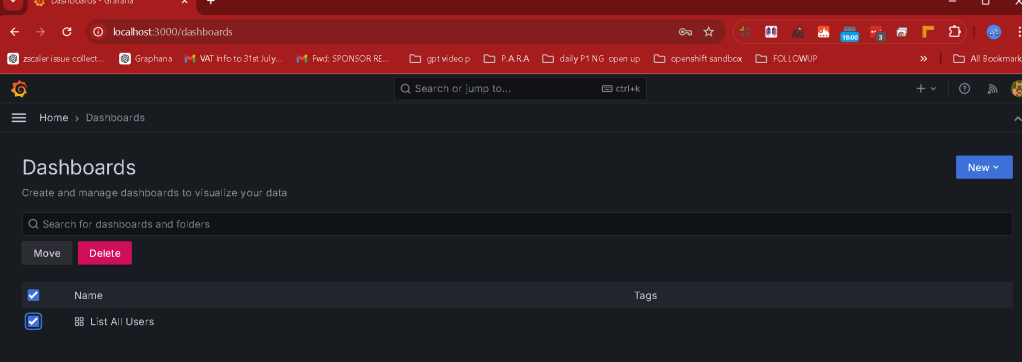
3. Save JSON Files in Git Repository
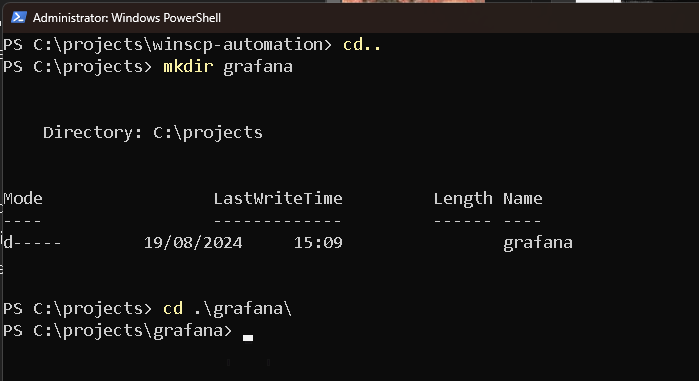
- Initialize a Git Repository:
Create a new directory for your project.
-
Initialize a Git repository in this directory:
bash git init -
Organize JSON Files:
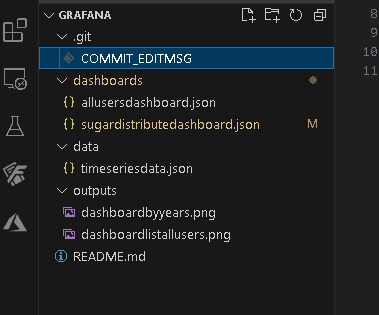
Create a folder structure to store the JSON files. For example:
grafana-dashboards/ ├── dashboards/ │ ├── dashboard1.json │ ├── dashboard2.json │ └── ... └── README.md
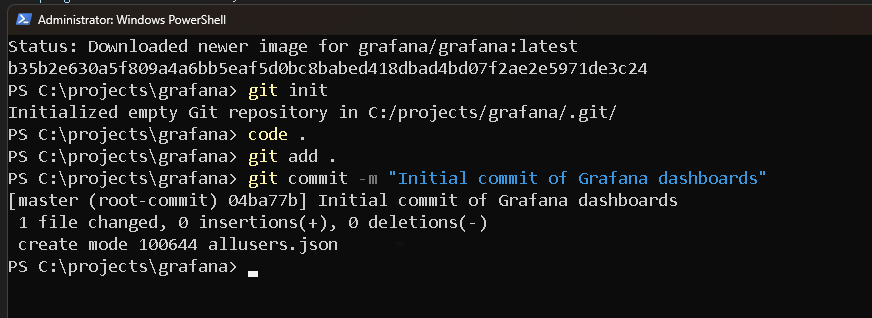
- Commit Changes:
Add your JSON files to the repository:
bash git add dashboards/*.json
- Commit the changes:
bash git commit -m "Initial commit of Grafana dashboards"
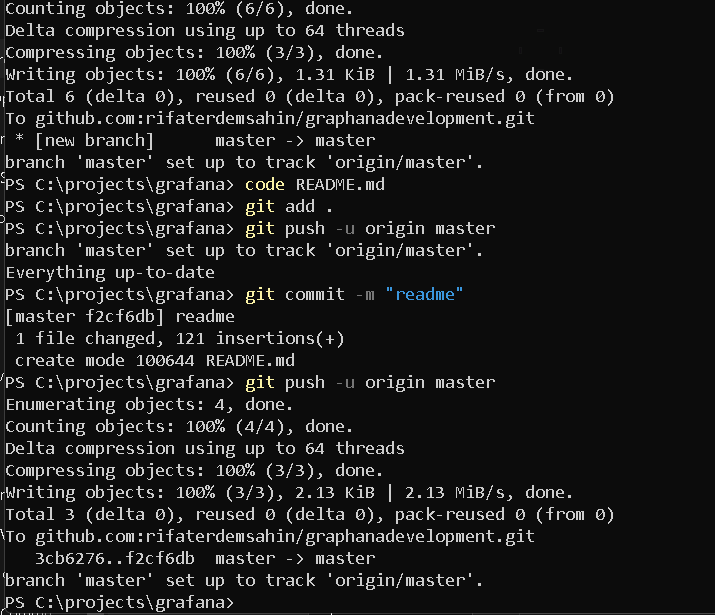
4. Upload to GitHub
- Create a GitHub Repository:
Go to GitHub and create a new repository.
- Push Local Repository to GitHub:
Add the remote URL to your local repository:
bash git remote add origin https://github.com/yourusername/grafana-dashboards.git
- Push the changes to GitHub:
bash git push -u origin master
5. Documentation
- Create a README.md File:
Write a README file that explains the project, how to set up Grafana, and how to import the dashboards.
- Include instructions on how to clone the repository and load the JSON files into a Grafana instance.
6. Enhancements (Optional)
- Automate Dashboard Exports:
Write a script that periodically exports the dashboards as JSON files and commits them to the repository.
- Add More Dashboards:
Create additional dashboards that connect to different data sources or use more advanced Grafana features.
- Version Control for Dashboards:***
Implement version control practices by tagging releases or using branches to manage different versions of the dashboards.
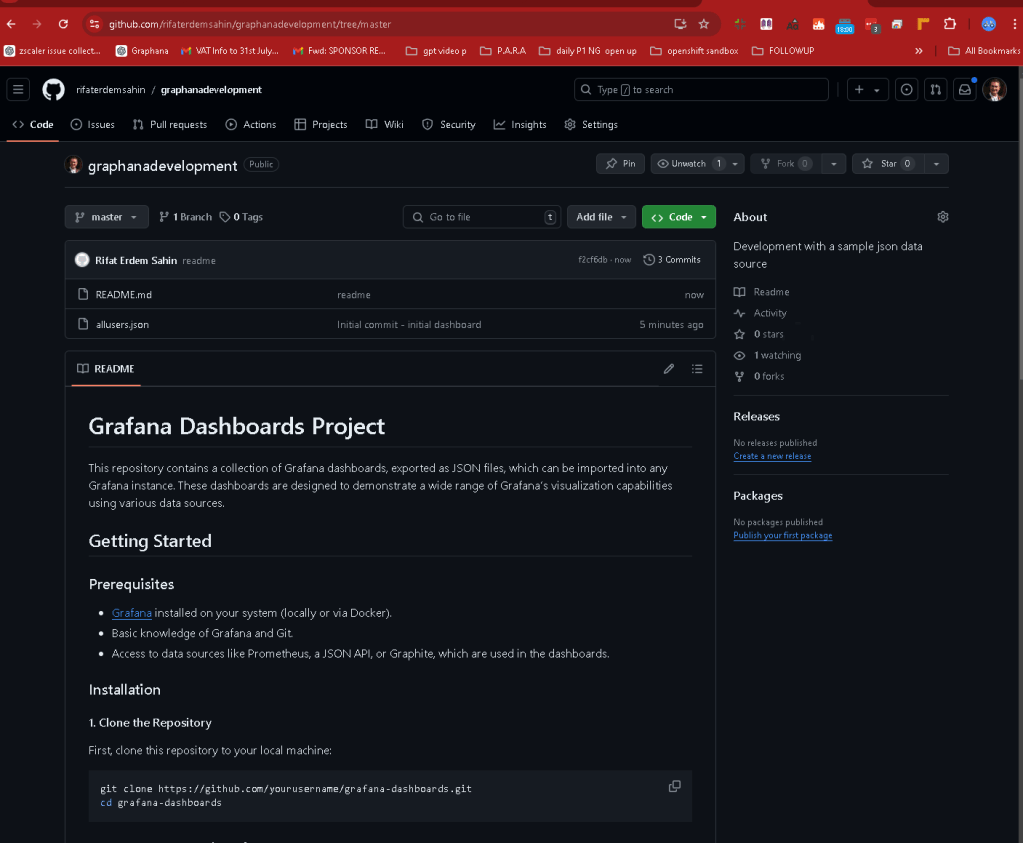
Sample README.md Content
Grafana Dashboards Project
This project contains a collection of Grafana dashboards, which are exported as JSON files. These dashboards can be imported into any Grafana instance.
Getting Started
Prerequisites
- Grafana installed locally or via Docker.
- Basic knowledge of Grafana and Git.
Installation
- Clone this repository:
bash
git clone https://github.com/yourusername/grafana-dashboards.git
cd grafana-dashboards
- Import dashboards into Grafana:
- In Grafana, go to "Dashboards" > "Manage" > "Import".
- Upload the JSON files from thedashboards/directory.
Dashboard Descriptions
- dashboard1.json: Description of the first dashboard.
- dashboard2.json: Description of the second dashboard.
- ...
Contributing
Contributions are welcome! Please fork this repository and submit a pull request with your improvements or additional dashboards.
License
This project is licensed under the MIT License - see the LICENSE.md file for details.
Final Thoughts
By following these steps, you will gain practical experience in setting up and managing Grafana dashboards, exporting and versioning them as JSON files, and collaborating on these files using Git and GitHub.
**Test Docker and Other Features **
Your Own Json
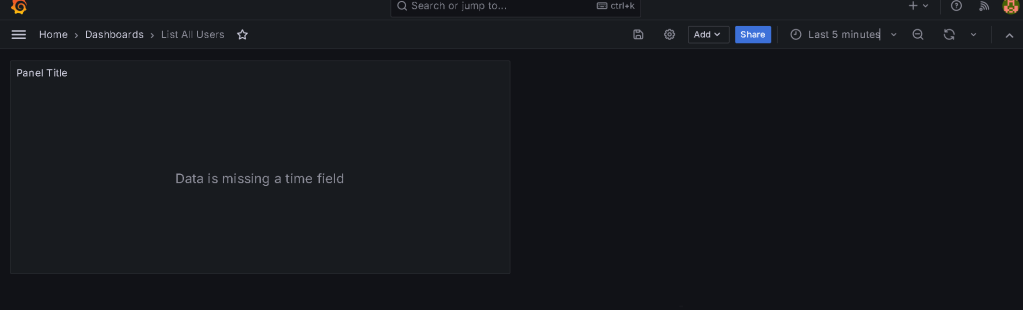
To display the provided JSON data in Grafana, especially when the data does not contain a native time field but instead has a "year" field, you can use Grafana's transformation features to convert the "year" field into a time field. Here’s how you can set it up:
Step 1: Prepare Your Data Source
Before setting up the table in Grafana, ensure your JSON data is available via a data source. This could be through a custom API serving the JSON or by using the SimpleJson plugin, as explained earlier.
Step 2: Add the Data Source to Grafana
-
Add a Data Source:
-
Go to Configuration > Data Sources in Grafana.
-
Click on Add data source and select your JSON data source (e.g., SimpleJson).
-
Test the Data Source:
-
Ensure that the connection to the data source is successful.
Step 3: Create a New Dashboard and Add a Table Panel
-
Create a New Dashboard:
-
Go to Dashboards > New Dashboard.
-
Click on Add new panel.
-
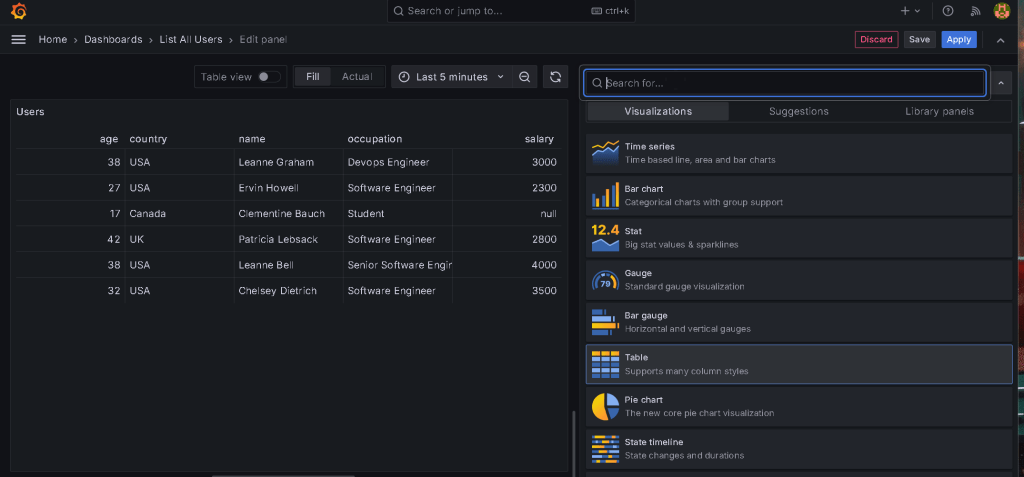
Configure the Panel:
-
Select Table as the visualization type.
-
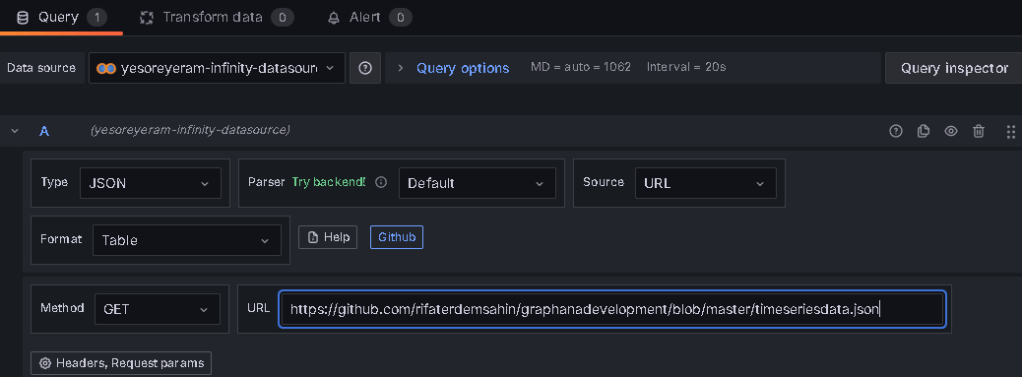
Query Your Data:
-
In the Query editor, select your JSON data source.
-
Ensure that your query retrieves the data that includes the "country," "year," "sugar_production," "sugar_import," and "sugar_export" fields.
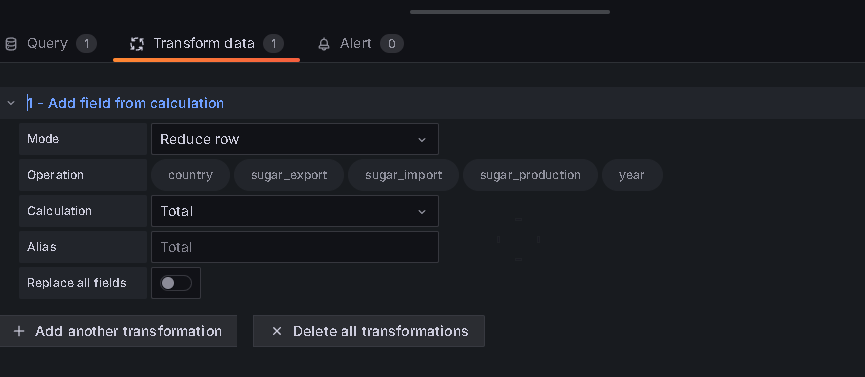
Step 4: Transform the Year Field into a Time Field
Since Grafana expects a time field to plot time series data, you'll need to convert your "year" field into a time field.
-
Add a Transform:
-
In the panel editor, go to the Transform tab.
-
Click Add transformation and choose "Add field from calculation".
-
Create a Time Field:
-
Choose the "Time" calculation type.
-
Use the "Field Name" option to select your "year" field.
-
In the calculation, multiply the year by
31536000000(the number of milliseconds in a year) and add the appropriate offset to match your desired start date. For example:
(year - 1970) * 31536000000
This converts the "year" into a Unix timestamp. -
Organize Fields:
-
You may want to use the Organize fields transformation to rename, reorder, or hide certain fields as necessary.
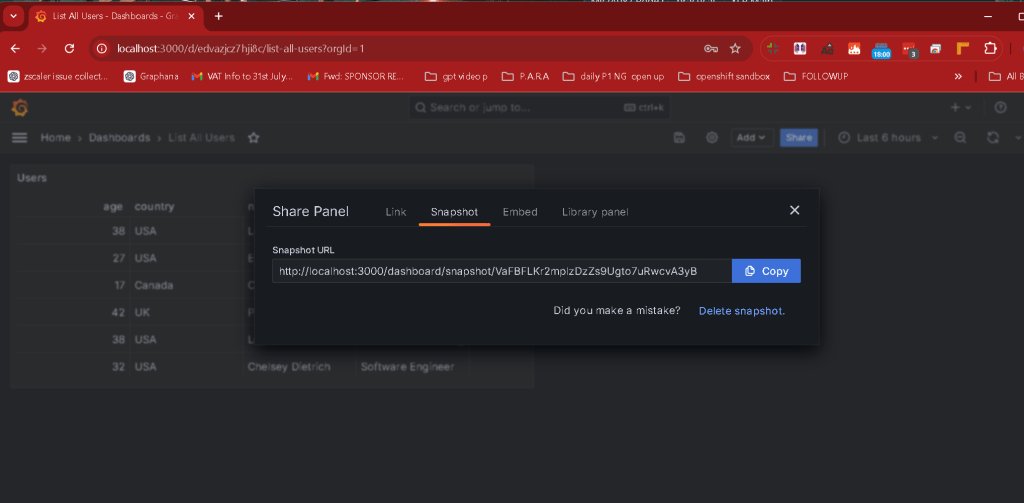
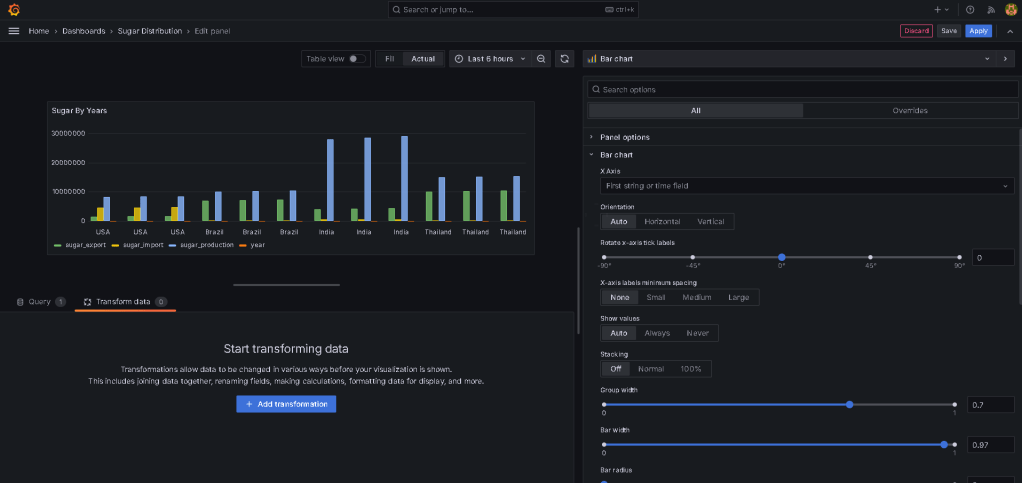
Step 5: Visualize the Data
-
Adjust Time Range:
-
Ensure your time range in the top-right corner of the Grafana interface is set appropriately to include the years you’re displaying.
-
You might need to manually adjust the range to cover the years (e.g., 2023-2030).
-
Customize the Table:
-
Configure the table’s columns, sorting, and other options to properly display the "country," "sugar_production," "sugar_import," and "sugar_export" fields.
-
Save the Dashboard:
-
Once everything is set up, click Save to store your dashboard.
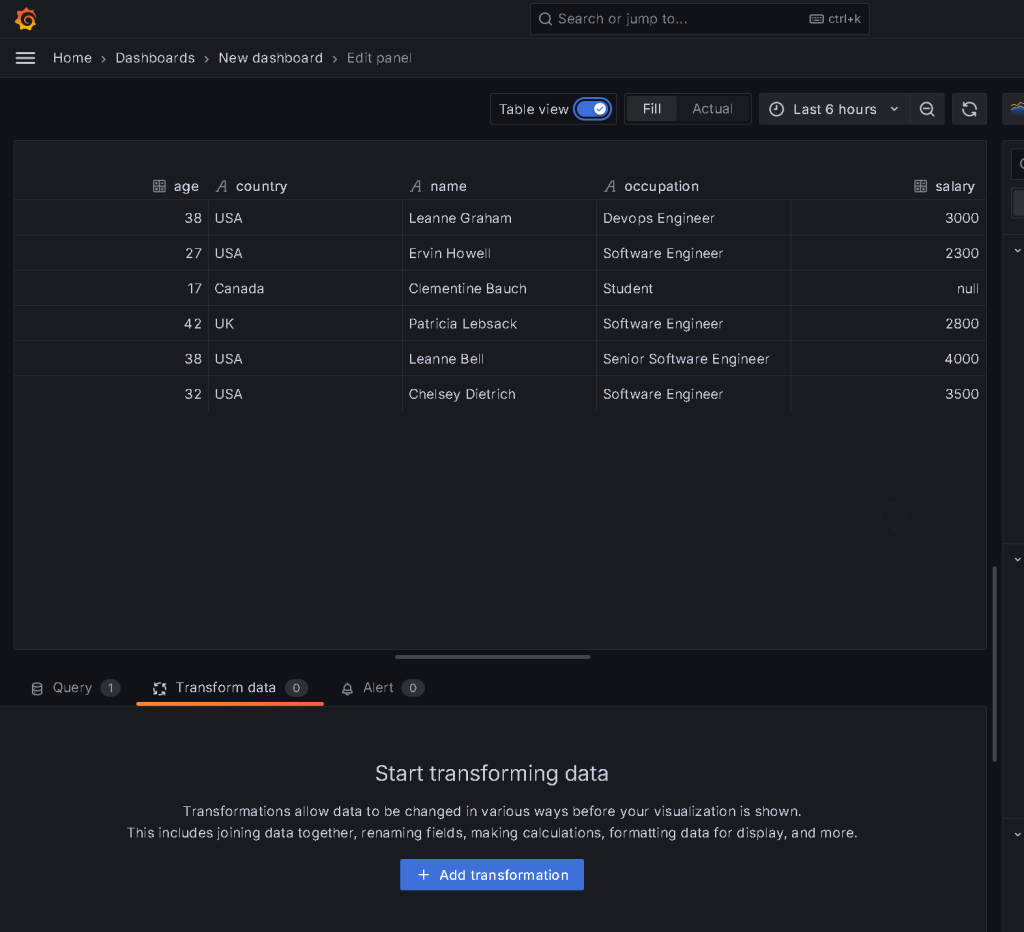
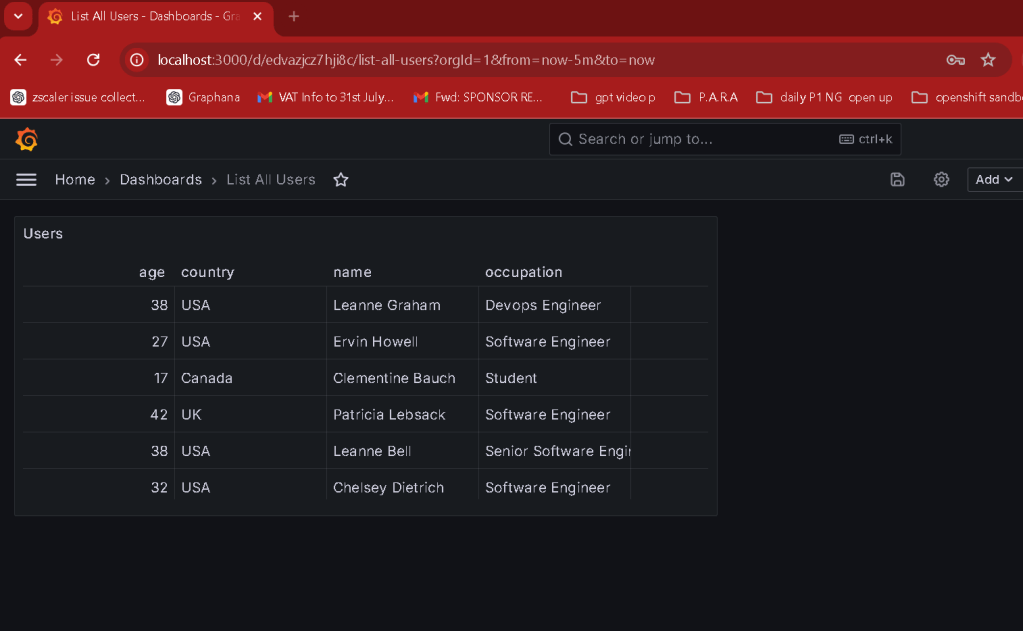
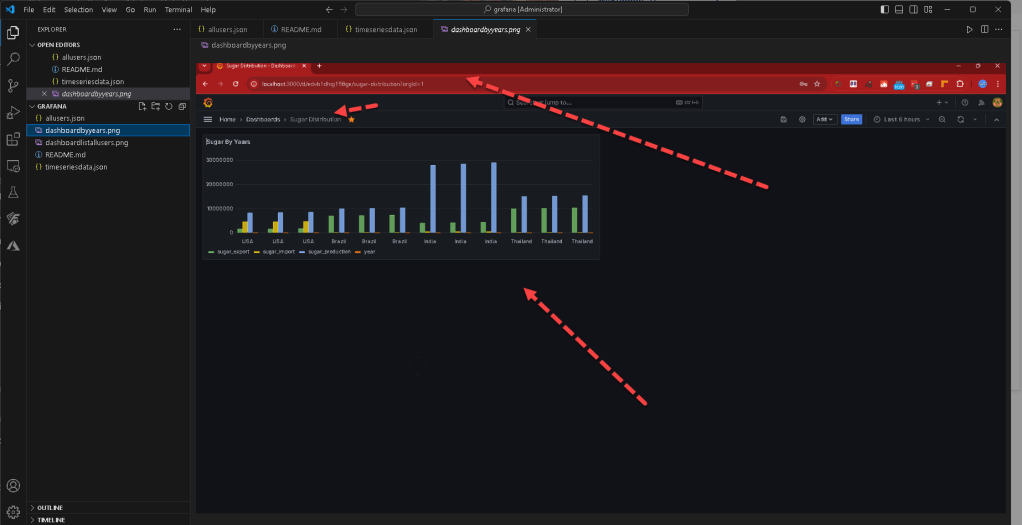
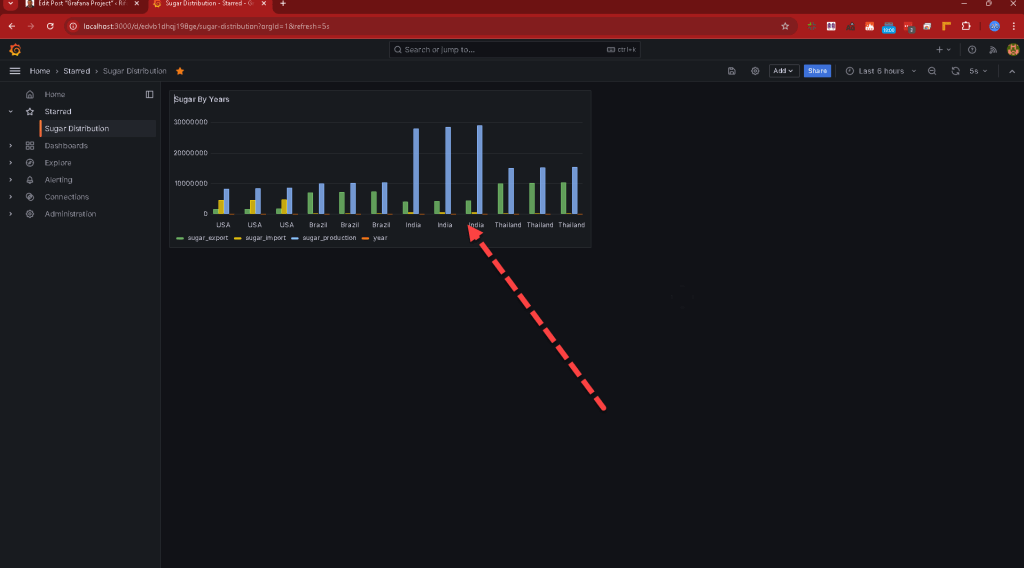
Example Table Display
Your table panel should now display rows with "country," "year," "sugar_production," "sugar_import," and "sugar_export," with the "year" correctly interpreted as a time field. This setup will allow Grafana to treat your data as time-series data, enabling further analysis and visualization.
By converting the "year" into a Unix timestamp, you ensure that Grafana can plot this data over time, even if your original JSON data didn’t have a native time field.
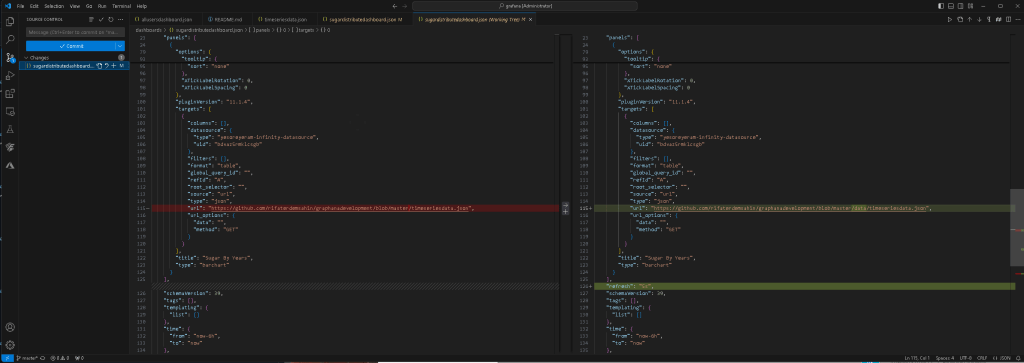
added images
GET UPDATED FILE
FIX THE FOLDER STRUCTURE
FINAL FOLDER STRUCTURE
REUSE DOCKER TOMORROW
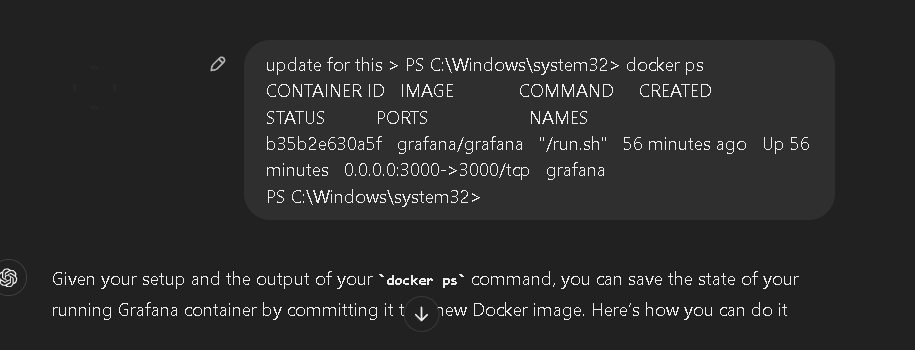
To save the state of a running Docker container as a new Docker image, you can use the docker commit command. This command creates a new image from the changes made to a running container. Here’s how you can do it:
Step 1: Identify the Running Container
First, you need to find the container ID or name of the running container whose state you want to save.
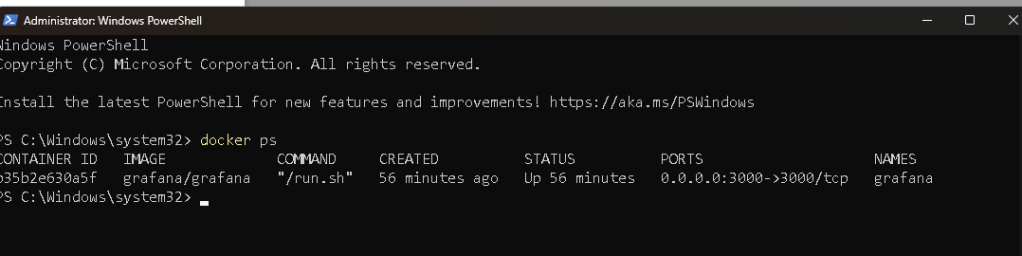
Run the following command to list all running containers:
docker ps
This will show you a list of all running containers, including their container ID and name.
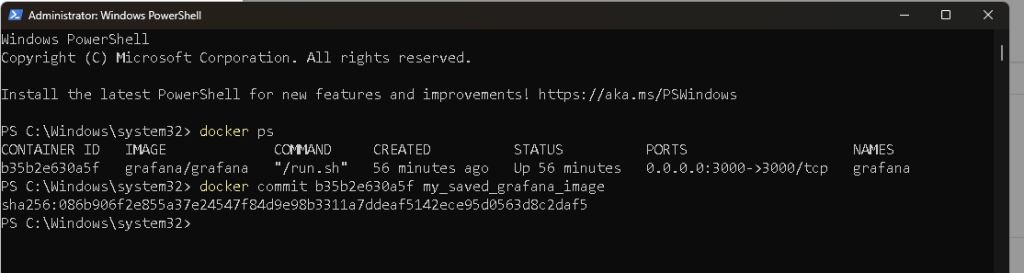
Step 2: Commit the Container to a New Image
Once you have the container ID or name, you can use the docker commit command to create a new image.
The syntax is:
docker commit [OPTIONS] CONTAINER_ID_OR_NAME NEW_IMAGE_NAME
For example, if your container ID is abc123def456 and you want to save it as an image named my_saved_image, you would run:
docker commit abc123def456 my_saved_image
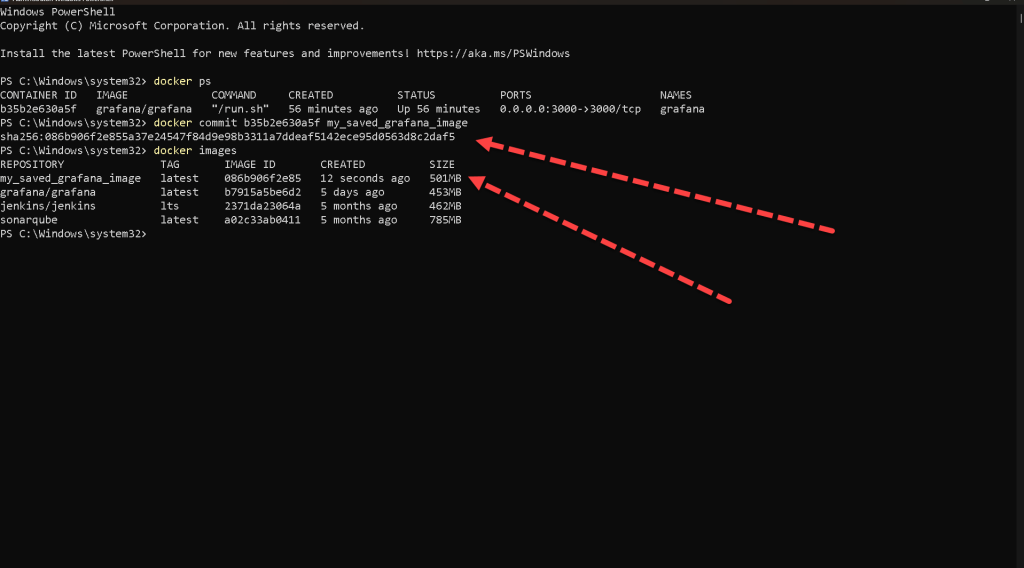
Step 3: Verify the New Image
After committing the container to a new image, you can verify that the image has been created by listing all images:
docker images
You should see my_saved_image listed among your Docker images.
Step 4: Use the New Image
You can now use this new image to start new containers that start from the saved state of the original container. For example:
docker run -d my_saved_image
Additional Options for docker commit
-
-m "message": You can add a commit message to describe the changes.
-
-a "author": You can specify the author of the image.
-
-c "command": You can modify the Dockerfile instructions for the new image.
Example with options:
docker commit -m "Updated config files" -a "John Doe" abc123def456 my_saved_image
This saves the state of the running container as a new image with a commit message and author information.
Conclusion
The docker commit command is a straightforward way to save the current state of a running container as a new Docker image. This is useful for capturing the state of a container after making changes or updates that you want to preserve.
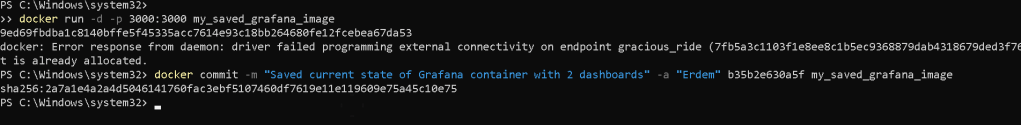
new version for you to run
docker commit -m "Saved current state of Grafana container with 2 dashboards" -a "Erdem" b35b2e630a5f my_saved_grafana_image
restart and try
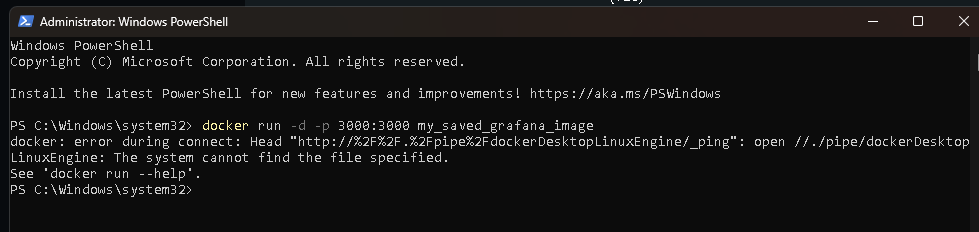
docker run -d -p 3000:3000 my_saved_grafana_image
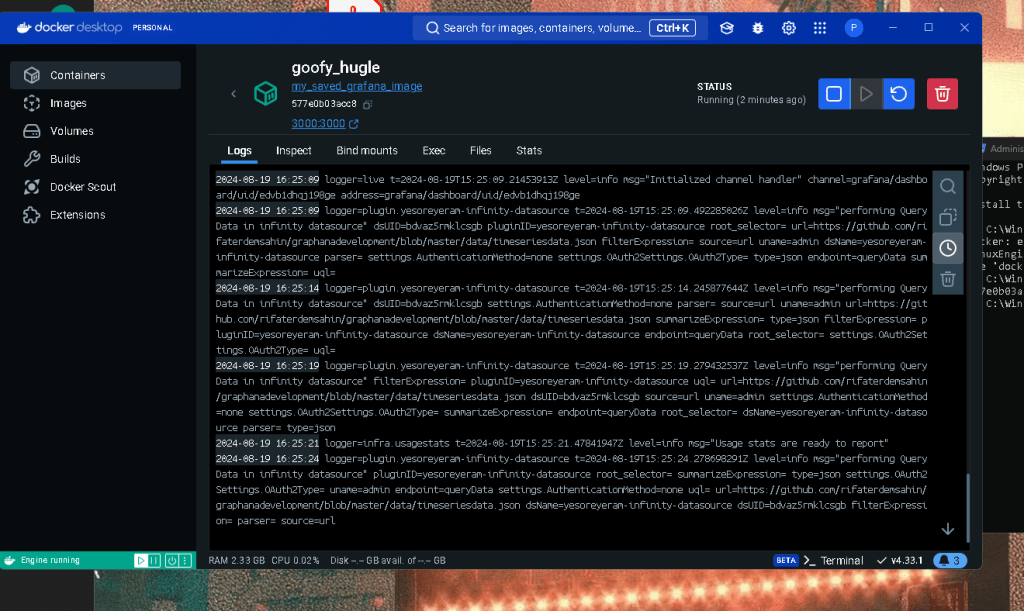
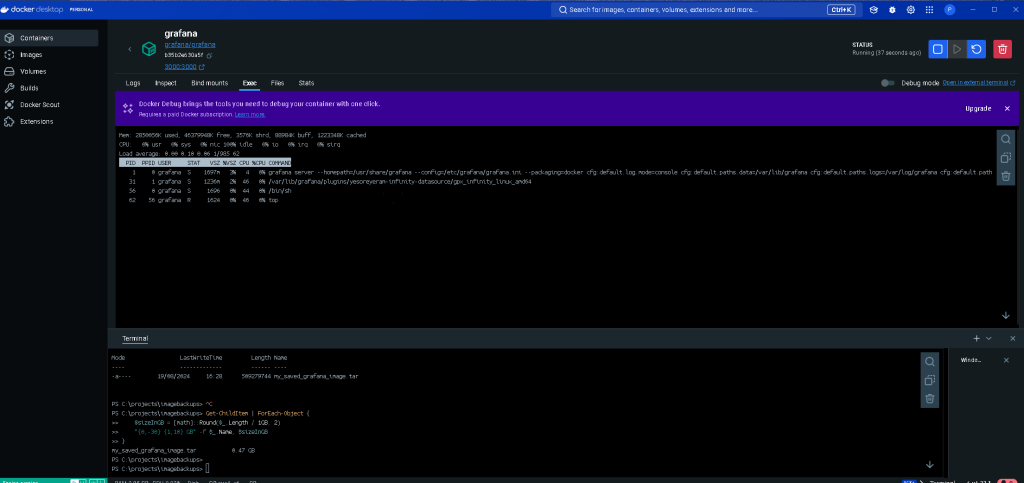
before restart check on docker terminal
Reference > https://github.com/rifaterdemsahin/graphanadevelopment
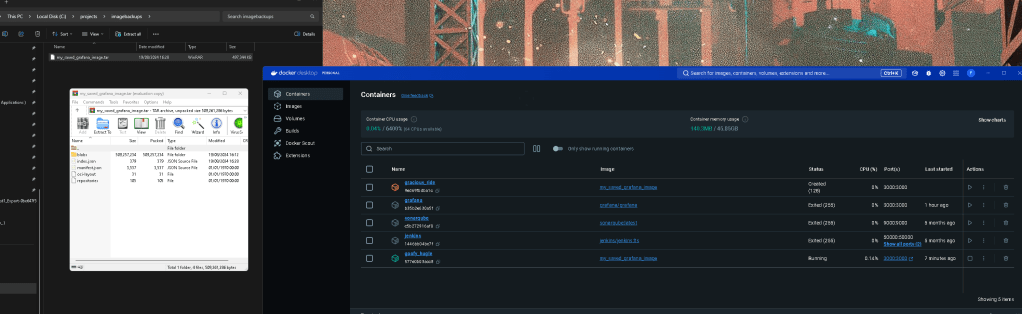
After Restart
open docker desktop and than run the nysaved graphana
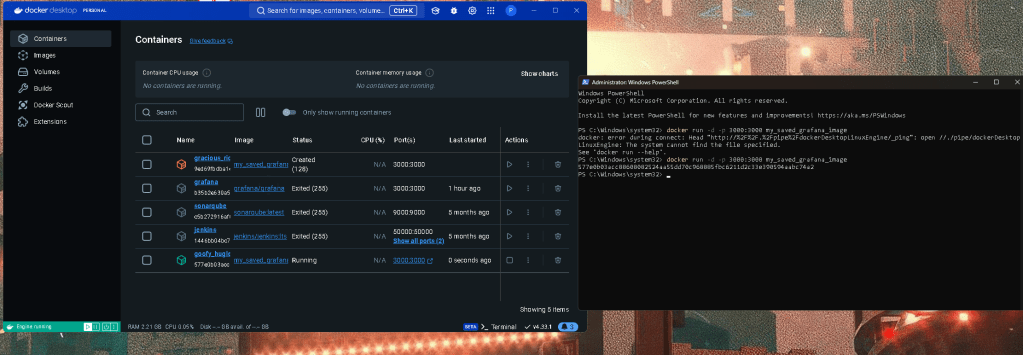
and click on the link for the local host and it still works
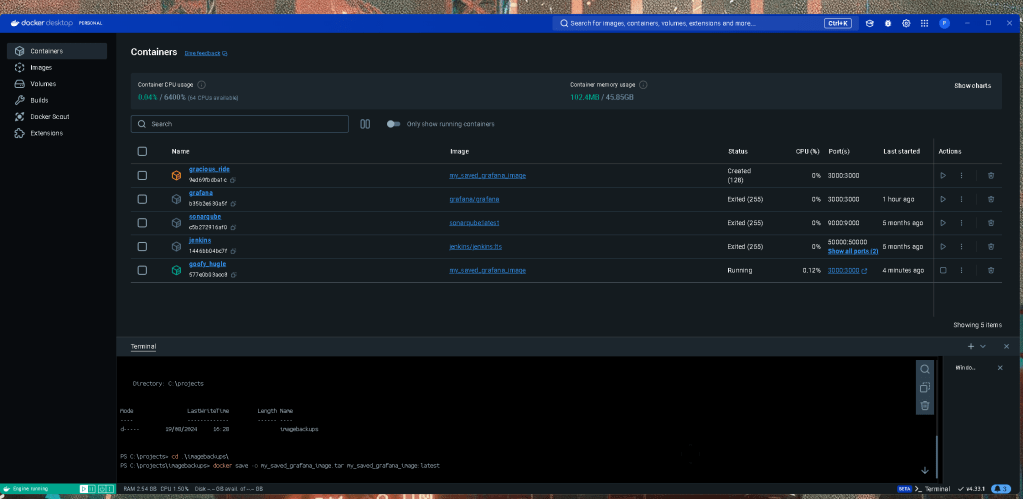
save the docker image to a file >
It looks like you're providing a step-by-step guide to save a running Docker container as an image and then save that image to a file. Here's a refined version of the instructions, including the name of the image you mentioned (my_saved_grafana_image:latest):
- Commit the running container to an image: First, commit the running container to a new Docker image. Replace
<container_id>with your container's ID or name.
docker commit
- Save the image to a tar file: Next, save the Docker image to a tar file. Replace
<file_name>.tarwith the name of the tar file you want to create.
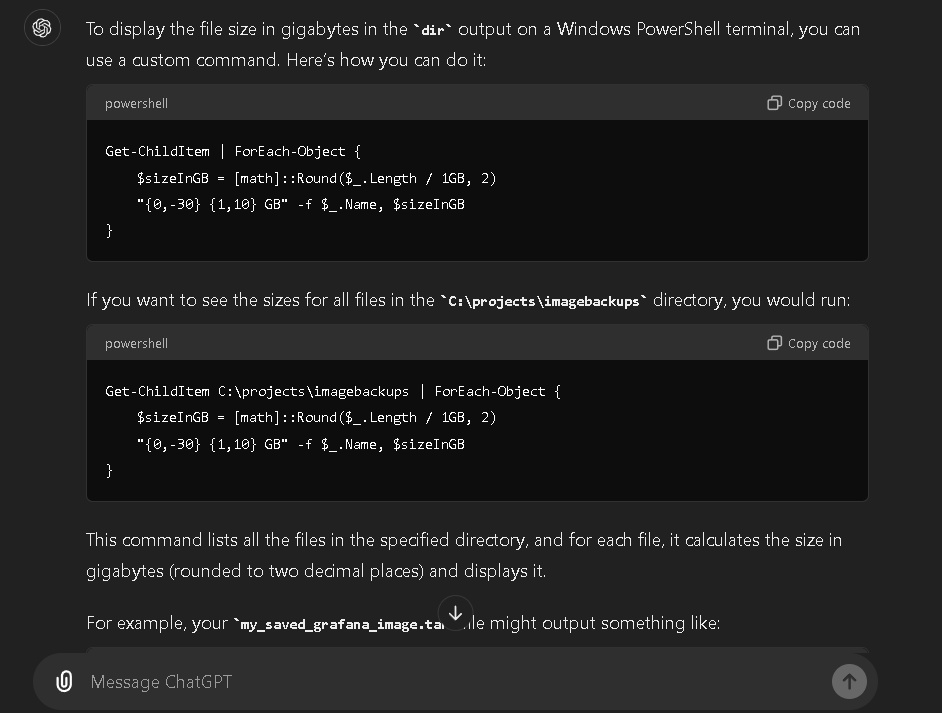
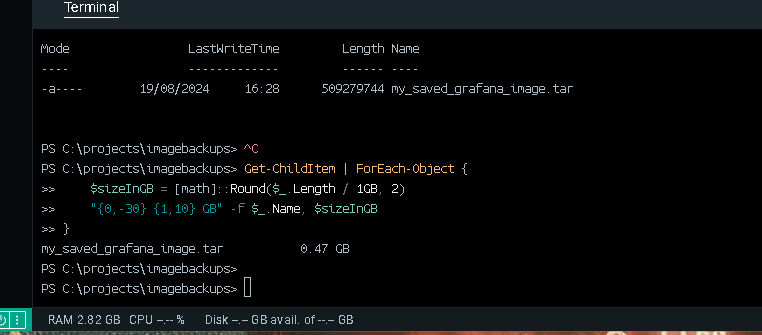
docker save -o my_saved_grafana_image.tar my_saved_grafana_image:latest
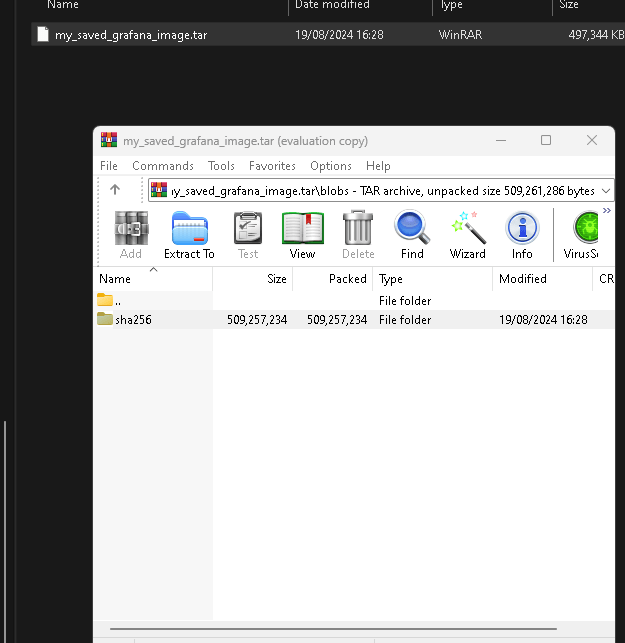
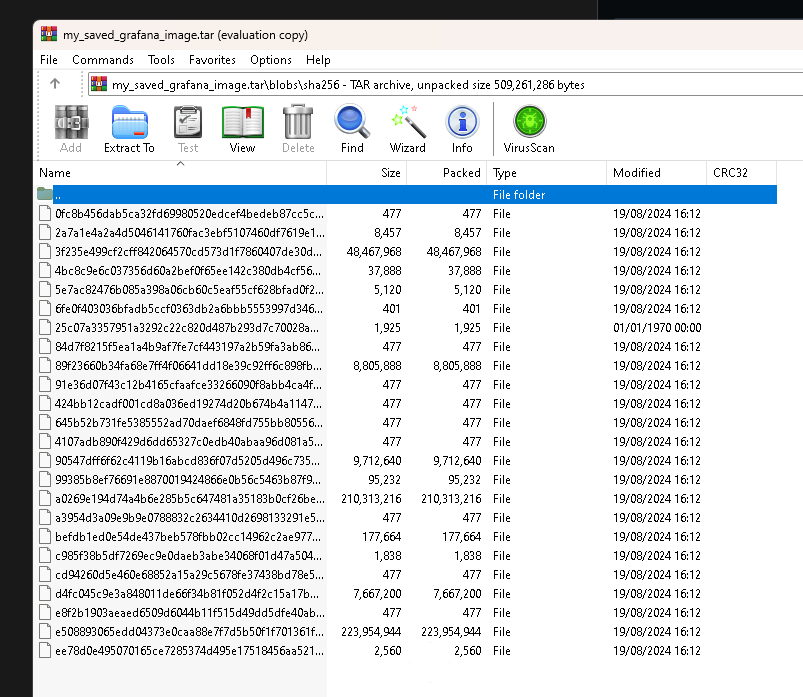
This my_saved_grafana_image.tar file now contains your Docker image. You can transfer this file, back it up, or use it elsewhere.
To load this image back into Docker on another system, use the docker load command:
docker load -i my_saved_grafana_image.tar
This will make the image available on the new system, ready to be run as a container.
Inception everywhere
Imported from rifaterdemsahin.com · 2025