🚀 How to Install OpenShift Monitoring Operator in 5 Easy Steps
Monitoring your OpenShift cluster is crucial to maintain optimal performance and troubleshoot issues effectively. In this blog post, I'll walk you through how to install the OpenShift Monitoring Operator with ease! Let's dive in and get your cluster monitored in no time. 🎯
💡 Why OpenShift Monitoring?
OpenShift Monitoring is a powerful tool for collecting and visualizing metrics related to your cluster’s health, resources, and performance. With the Monitoring Operator, you gain built-in support for Prometheus and Grafana, allowing you to create dashboards, set alerts, and gain deep insights into your OpenShift environment.
🚀 Steps to Install OpenShift Monitoring Operator
1️⃣ Log in to Your OpenShift Console
First, log in to your OpenShift web console or CLI with the necessary administrator privileges.
oc login --token=
Screenshot Pause: 🔍 Don't forget to take a screenshot of the login page or CLI for your reference!
2️⃣ Navigate to the OperatorHub
-
Once logged in, go to the OperatorHub within the OpenShift console. This is the central place to find and install operators.
-
In the search bar, type Monitoring and find the OpenShift Monitoring Operator.
Go with OTEL
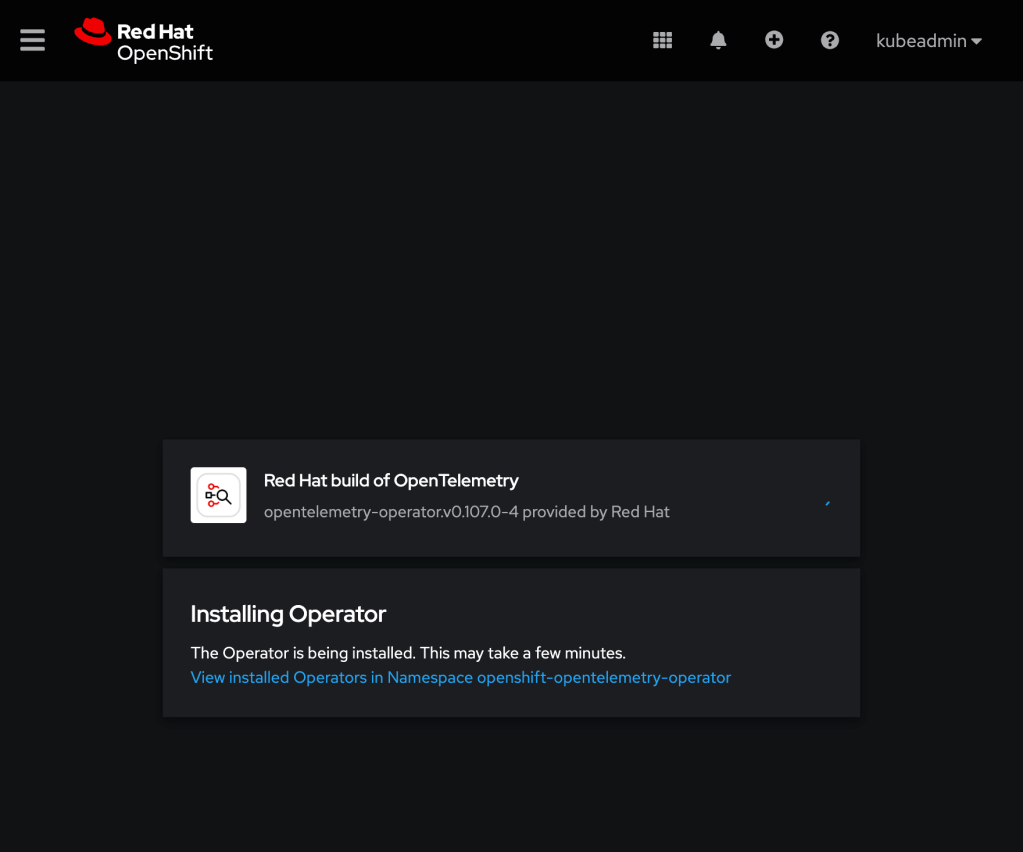
3️⃣ Install the Monitoring Operator
-
Click on the OpenShift Monitoring Operator and select Install.
-
Choose the appropriate installation mode:
-
All namespaces on the cluster (default): This will install the operator in all namespaces.
-
A specific namespace: This limits the installation to a single namespace.
-
Once the configuration is set, hit Install.
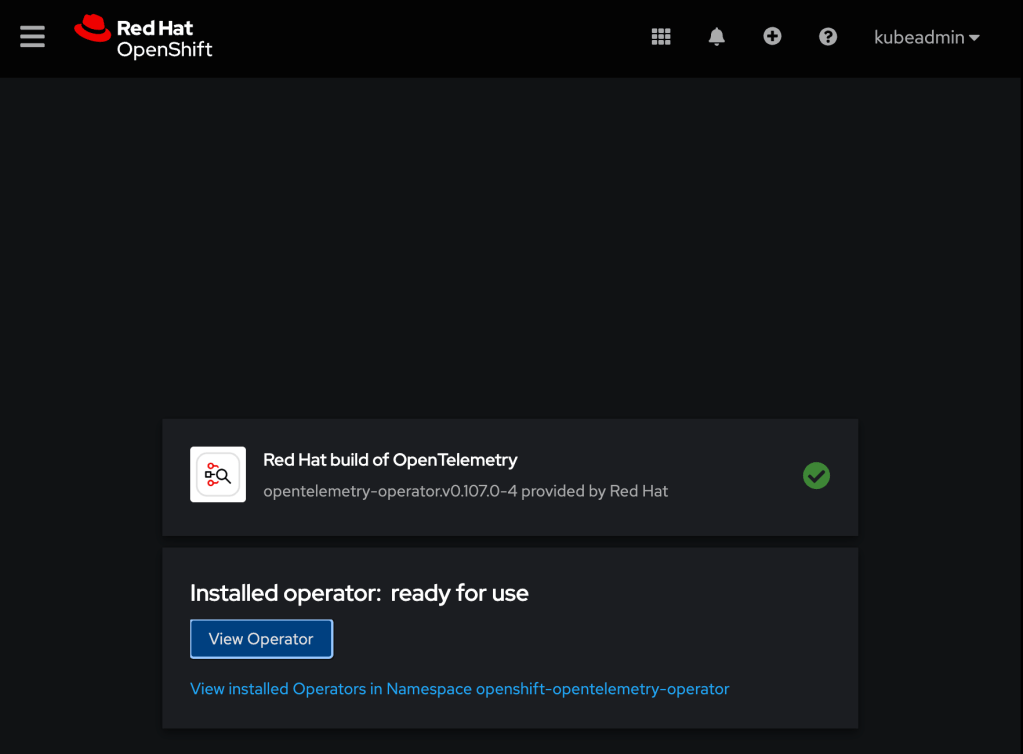
4️⃣ Verify the Installation
- After a few moments, you should see the Monitoring Operator installed and running. Head to the Installed Operators section to verify that the operator is up and operational.
Screenshot Pause: ✅ Capture a screenshot of the success notification or Installed Operators tab for future use!
5️⃣ Access the Monitoring Dashboards
-
The Monitoring Operator integrates with Prometheus and Grafana by default. Navigate to Monitoring in your console to access real-time metrics, alerts, and logs for your OpenShift cluster.
-
Explore the Prometheus and Grafana dashboards for detailed insights into your cluster performance. You can also customize these dashboards based on your needs!
🎯 What’s Next?
Now that you have OpenShift Monitoring installed, it’s time to set up alerts, dashboards, and metrics that matter most to your infrastructure. Stay ahead of any potential issues and optimize your cluster’s performance with these powerful tools.
🔗 Connect with me:
-
💼 LinkedIn: https://www.linkedin.com/in/rifaterdemsahin/
-
🐦 Twitter: https://x.com/rifaterdemsahin
-
🎥 YouTube: https://www.youtube.com/@RifatErdemSahin
-
💻 GitHub: https://github.com/rifaterdemsahin
Let’s make the most of OpenShift’s powerful monitoring tools and keep our clusters running smoothly! 👨💻💥
Imported from rifaterdemsahin.com · 2025