🚀 How to View the Monitoring Tab for Jaeger Tracing in OpenShift
If you're running Jaeger tracing in OpenShift and wondering how to access the monitoring tab, you're in the right place! Let's break it down step by step to ensure you can view your Jaeger traces and monitor your application's performance effortlessly.
🔍 Step 1: Log in to OpenShift
Head over to your OpenShift Web Console and log in with your credentials. Once you're in, you should be greeted by the familiar dashboard.
🛠️ Step 2: Navigate to the "Monitoring" Section
-
OpenShift Web Console provides a comprehensive view of your cluster and application performance, including Jaeger tracing.
-
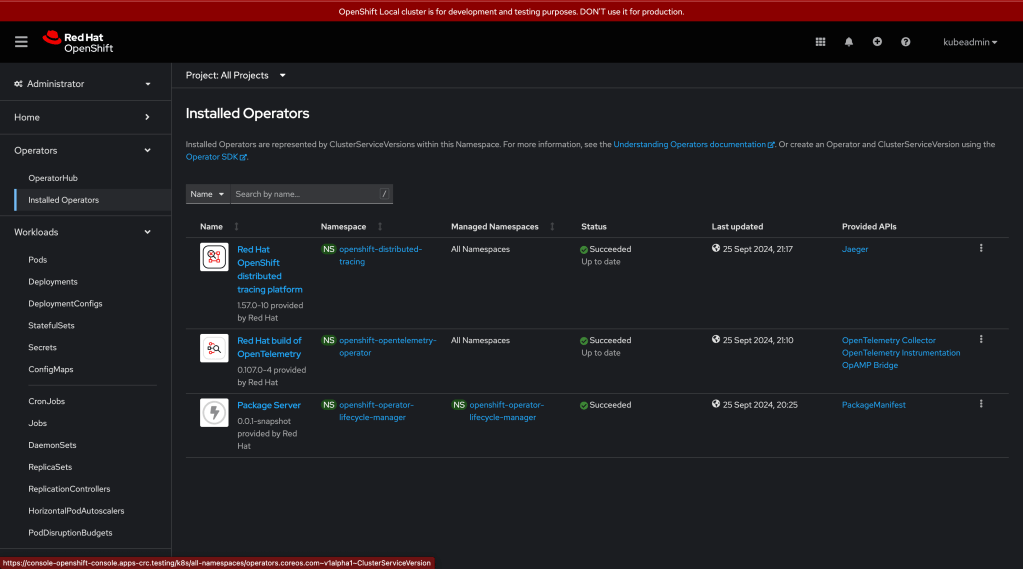
In the console, locate the Monitoring option on the left sidebar. It’s usually found under the Observe section. 💡 Tip: If you can't see the Monitoring tab, make sure that you have the required permissions and the necessary operators installed.
🎯 Step 3: Access Jaeger Tracing
Once in the Monitoring tab, select Jaeger Tracing. Here, you should be able to see all the traces that Jaeger has captured for your application.
📊 Step 4: Explore Your Traces
-
Search for Traces: You can search for traces by filtering through various options like service name, operation, or even custom tags.
-
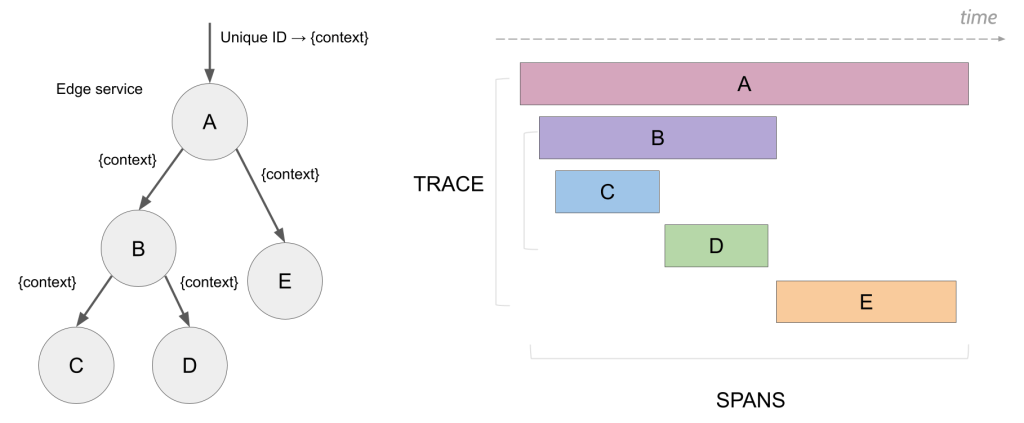
Analyze Performance: Each trace shows you a detailed breakdown of your services' requests and how long each step took, helping you identify bottlenecks or performance issues.
-
Drill Down: You can click on any trace to see the deeper, granular steps of the request.
📸
** Reference Screenshot >** https://developers.redhat.com/articles/2023/12/21/how-get-more-openshift-service-mesh-monitoring
At this point, grab a screenshot to see how your traces look! You can document your workflow or monitor the performance in real time, showcasing what's happening within your microservices architecture.
🚀 Implementing Jaeger in your OpenShift cluster enables you to track every request and monitor the performance of your microservices with ease. The Monitoring tab is your gateway to detailed, real-time insights, helping you to ensure your system is always running at its best.
🔧 Troubleshooting: If you still can’t access Jaeger in the Monitoring tab, ensure that you have the OpenShift Jaeger Operator installed and configured correctly.
🔗 Connect with me:
I hope this guide helps you monitor your Jaeger traces in OpenShift. Feel free to reach out if you have any questions!
Imported from rifaterdemsahin.com · 2025