🚀 Why You Should Use Prometheus, Thanos, Loki, and Grafana for Observability in Modern Infrastructure
💡 What I Want to Achieve
In today's fast-paced, cloud-native environments, having a reliable observability stack is crucial for monitoring your systems. With Prometheus, Thanos, Loki, and Grafana, you get a highly flexible and powerful toolset for managing metrics and logs efficiently. Here's a breakdown of why this stack shines compared to other log and monitoring tools.
🌟 The Key Components
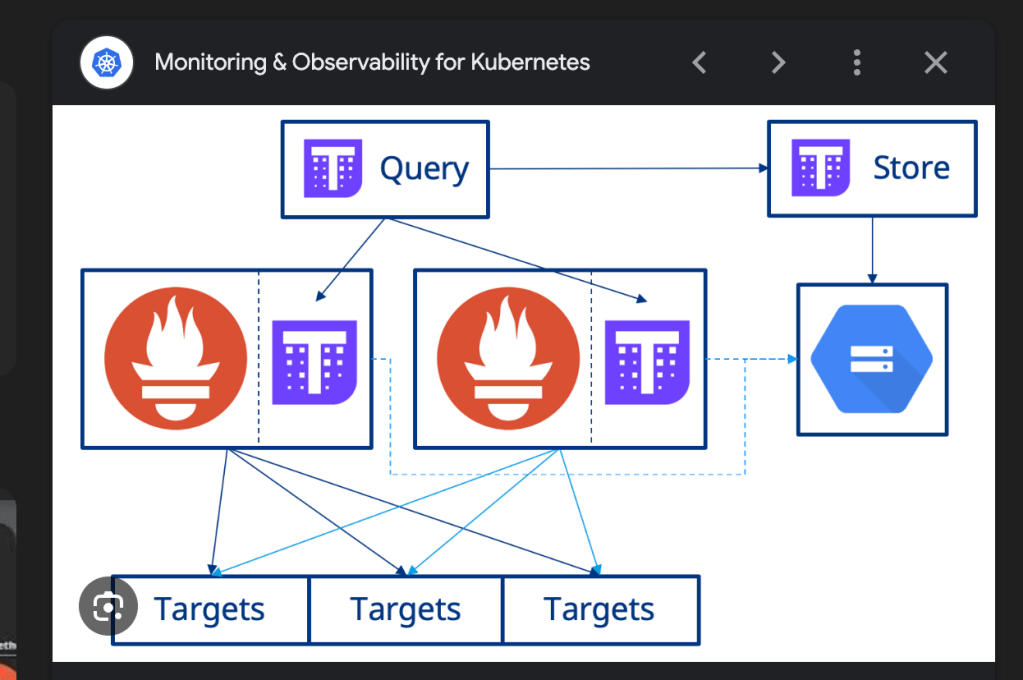
1. Prometheus:
-
Metrics collection and alerting superhero 💥.
-
Efficient time-series database with pull-based monitoring.
-
Perfect for real-time monitoring with native Kubernetes support.
2. Thanos:
-
The scalability champion 🏋️♀️ for Prometheus.
-
Adds high availability and long-term storage options.
-
Ideal for distributed environments where you need to retain data for long periods.
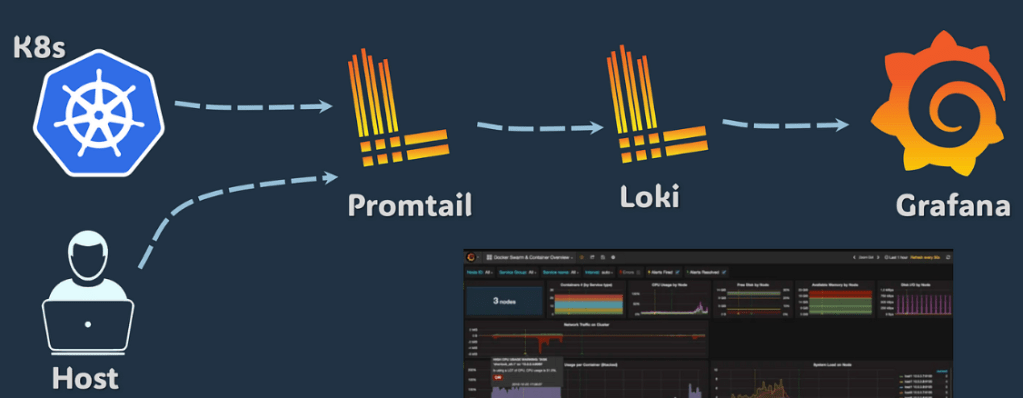
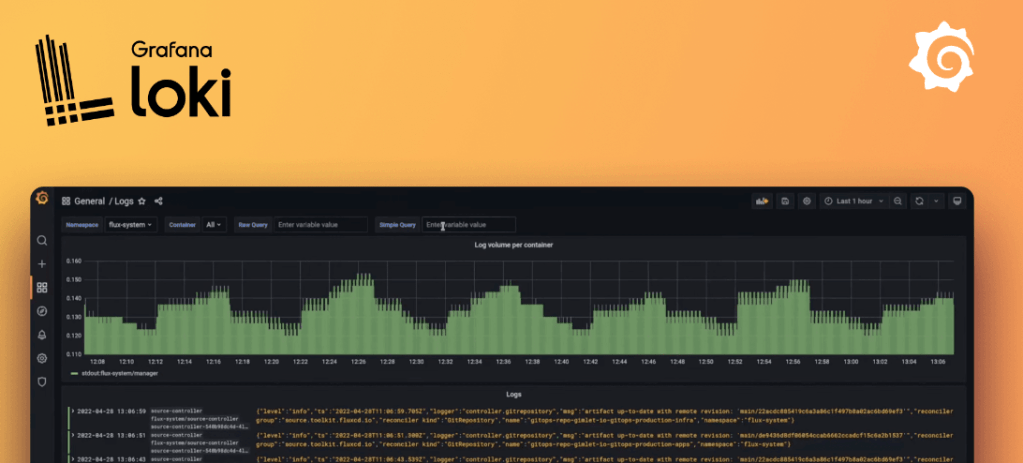
3. Loki:
-
Lightweight log aggregation system tailored for Prometheus logs 📜.
-
Doesn't index the log content — only labels, making it fast and efficient.
-
Scalable and cost-effective for handling large log volumes.
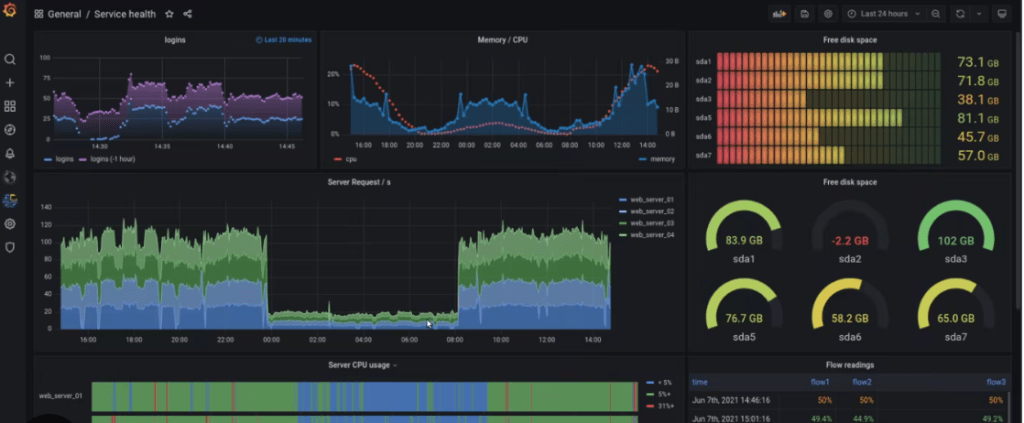
4. Grafana:
-
The visualization powerhouse 🎨 that brings all your data to life.
-
Highly flexible with powerful dashboarding and alerting capabilities.
-
Connects seamlessly to multiple data sources, not just Prometheus and Loki.
💡 Why Choose This Stack?
-
Unified Ecosystem: Seamless integration between metrics (Prometheus), logs (Loki), and long-term storage (Thanos).
-
Cost-effective: Lightweight, open-source tools designed for cloud-native environments.
-
Scalability: Thanos allows Prometheus to scale, and Loki efficiently handles large log volumes.
-
Open-source: No licensing fees, backed by a thriving community, and constantly evolving.
Compared to other tools, this stack is especially suited for Kubernetes and cloud-native environments, offering flexibility, scalability, and cost-efficiency without compromising on performance.
🔗 Connect with me:
-
💼 LinkedIn: Rifat Erdem Sahin
-
🐦 Twitter: @rifaterdemsahin
-
🎥 YouTube: Rifat Erdem Sahin
-
💻 GitHub: rifaterdemsahin
🚀 Start your journey to efficient monitoring and logging today with Prometheus, Thanos, Loki, and Grafana!
Imported from rifaterdemsahin.com · 2025