Viewing Grafana Dashboards from the Linux Terminal
Grafana is an incredibly powerful tool for visualizing and analyzing metrics from various data sources. While the web interface is the primary way to interact with Grafana, sometimes you might want to access or manage your Grafana dashboards directly from the Linux terminal. Whether you're working on a headless server, automating tasks, or just prefer the command line, this guide will walk you through how to view and manage Grafana dashboards from the terminal.
Prerequisites
Before you get started, ensure you have the following:
-
Grafana installed and running on your Linux server.
-
curl or httpie for making HTTP requests.
-
jq (optional) for parsing JSON output.
1. Accessing Grafana API
Grafana provides a comprehensive HTTP API that allows you to interact with dashboards, data sources, and other components. To view and manage dashboards, you'll use the Grafana HTTP API.
Authentication
Most Grafana setups use API tokens for authentication. You can generate an API token from the Grafana web UI:
-
Log in to Grafana.
-
Navigate to Configuration (⚙️) → API Keys.
-
Click Add API Key.
-
Enter a name, choose a role (Admin or Editor), and click Generate.
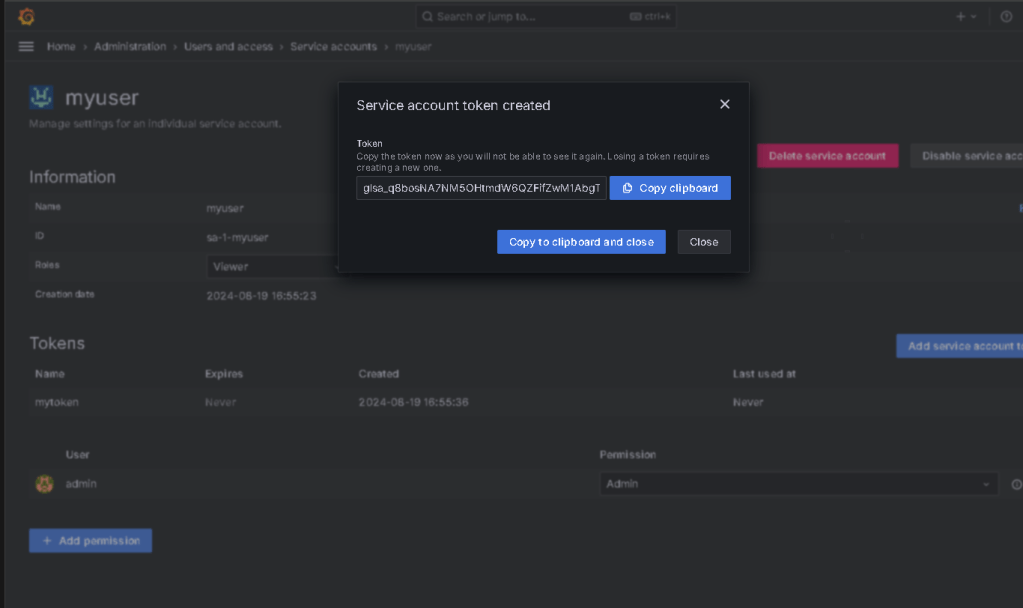
Save the API token securely; you’ll use it to authenticate your API requests.
Service account token ?
2. Listing Dashboards
To list all dashboards, you'll use the /api/search endpoint. This endpoint retrieves a list of dashboards that the authenticated user has access to.
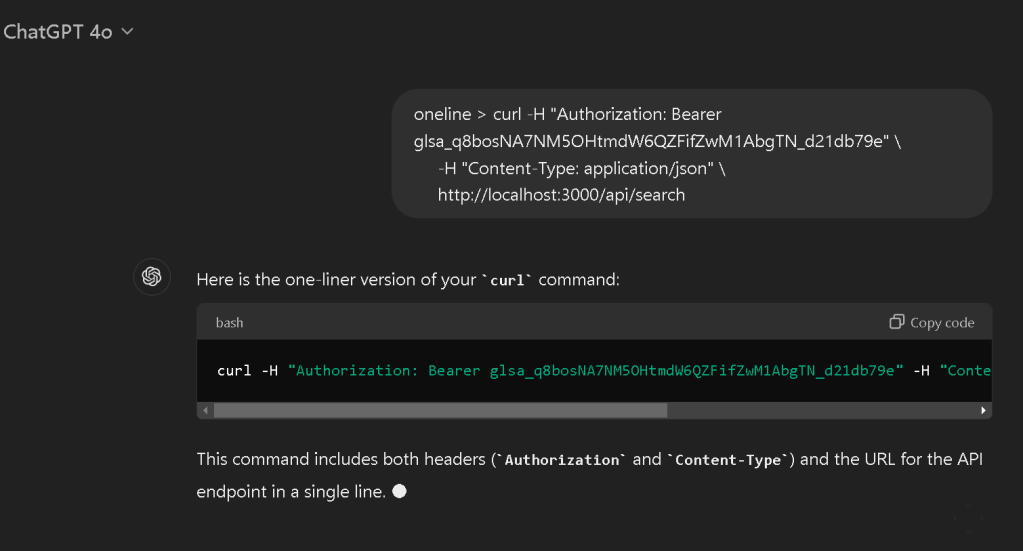
Using curl ( temp key in docker poc )
curl -H "Authorization: Bearer glsa_q8bosNA7NM5OHtmdW6QZFifZwM1AbgTN_d21db79e" \
-H "Content-Type: application/json" \
http://localhost:3000/api/search
Using httpie
http GET http://localhost:3000/api/search "Authorization: Bearer YOUR_API_TOKEN"
Replace YOUR_API_TOKEN with the token you generated, and adjust http://localhost:3000 if Grafana is running on a different address.
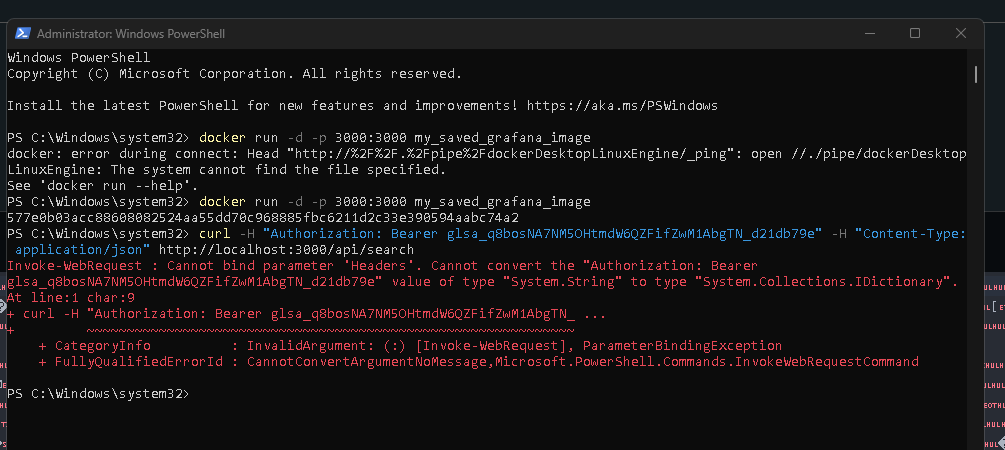
fix for your environment >
The error you're encountering is due to the fact that PowerShell's curl alias (which points to Invoke-WebRequest) expects headers to be passed as a dictionary rather than as a single string.
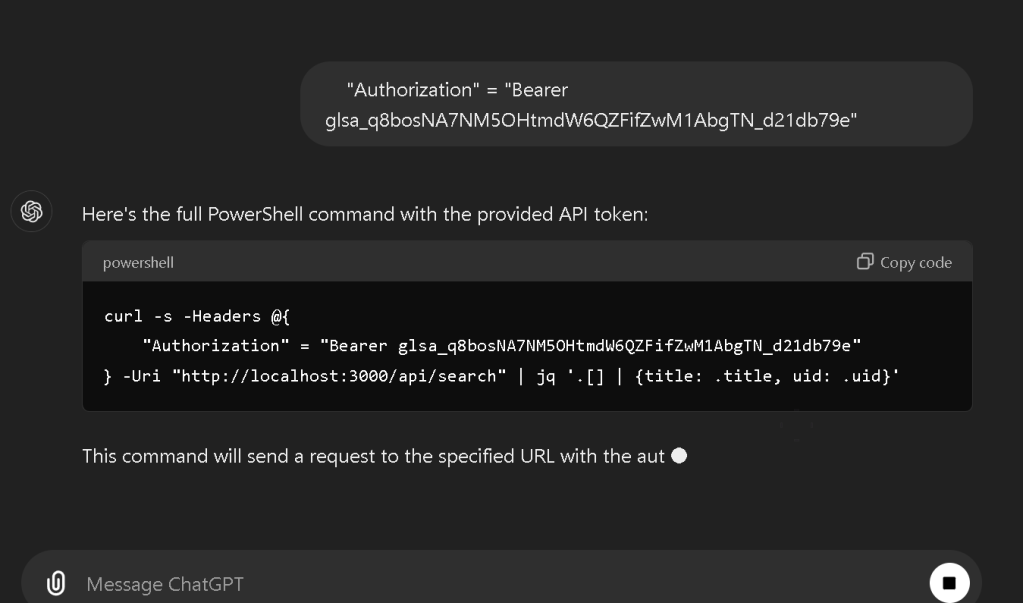
To fix this, you can use the -Headers parameter and pass a hashtable of headers, like this:
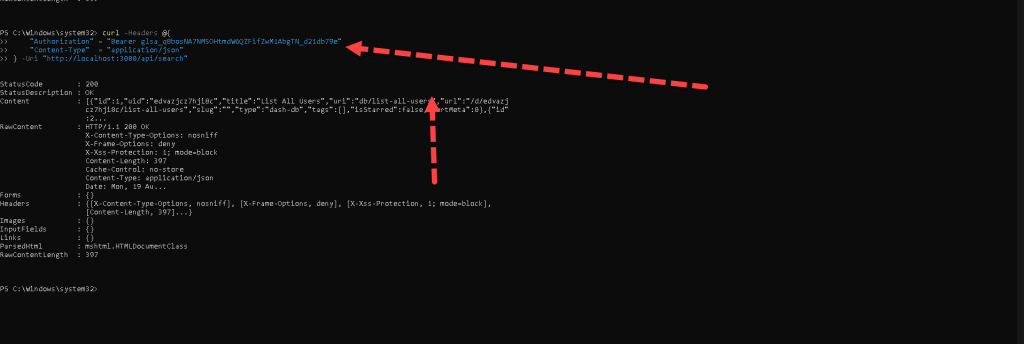
curl -Headers @{
"Authorization" = "Bearer glsa_q8bosNA7NM5OHtmdW6QZFifZwM1AbgTN_d21db79e"
"Content-Type" = "application/json"
} -Uri "http://localhost:3000/api/search"
This properly formats the headers in a way that PowerShell's Invoke-WebRequest command understands.
3. Viewing a Specific Dashboard
To view details of a specific dashboard, you'll need its UID (Unique Identifier). You can get this UID from the dashboard listing obtained in the previous step.
Use the /api/dashboards/uid/:uid endpoint to retrieve the dashboard's JSON definition.
Using curl
curl -H "Authorization: Bearer YOUR_API_TOKEN" \
-H "Content-Type: application/json" \
http://localhost:3000/api/dashboards/uid/YOUR_DASHBOARD_UID
Using httpie
http GET http://localhost:3000/api/dashboards/uid/YOUR_DASHBOARD_UID "Authorization: Bearer YOUR_API_TOKEN"
Replace YOUR_DASHBOARD_UID with the UID of the dashboard you want to view.
4. Parsing JSON Output
The output from these API requests is in JSON format. For easier reading or further processing, you can use jq, a powerful tool for querying and manipulating JSON data.
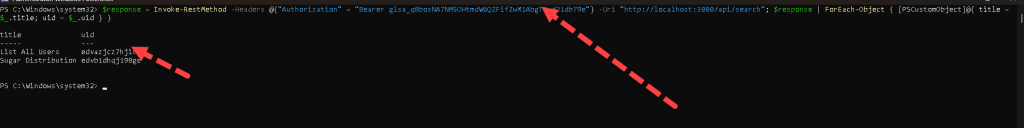
Example: Listing Dashboard Titles
curl -s -H "Authorization: Bearer YOUR_API_TOKEN" \
http://localhost:3000/api/search | jq '.[] | {title: .title, uid: .uid}'
This command retrieves a list of dashboards and extracts their titles and UIDs.
5. Automating with Scripts
You can create bash scripts to automate the retrieval and management of Grafana dashboards. For example, a script to list all dashboards and save them to files might look like this:
!/bin/bash
TOKEN="YOUR_API_TOKEN"
URL="http://localhost:3000"
Fetch all dashboards
dashboards=$(curl -s -H "Authorization: Bearer $TOKEN" "$URL/api/search")
Extract UIDs and titles
echo "$dashboards" | jq -c '.[] | {uid: .uid, title: .title}' | while IFS= read -r dashboard; do
uid=$(echo "$dashboard" | jq -r '.uid')
title=$(echo "$dashboard" | jq -r '.title')
# Fetch and save dashboard details
                curl -s -H "Authorization: Bearer $TOKEN" "$URL/api/dashboards/uid/$uid" > "${title}.json"
done
Conclusion
Viewing and managing Grafana dashboards from the Linux terminal can be a powerful way to interact with your monitoring setup, especially if you're working in a headless environment or prefer command-line tools. With Grafana's API, you can list, view, and manipulate dashboards with ease, integrating these capabilities into scripts and automation workflows.
By using the Grafana API, curl, and jq, you can efficiently handle your Grafana dashboards directly from the terminal. Happy monitoring!
Feel free to adjust the content as needed or add additional details specific to your setup or audience!
Imported from rifaterdemsahin.com · 2024