Understanding HAProxy Statistics: A Comprehensive Overview
Kubernetes Back end and Front End
HAProxy is a widely-used open-source load balancer and proxy server for TCP and HTTP-based applications that spreads requests across multiple servers. The statistics page of HAProxy provides valuable insights into the performance and health of the load balancer and the backend servers it manages. In this blog post, we will delve into the details provided in a typical HAProxy statistics report and understand what each section represents.
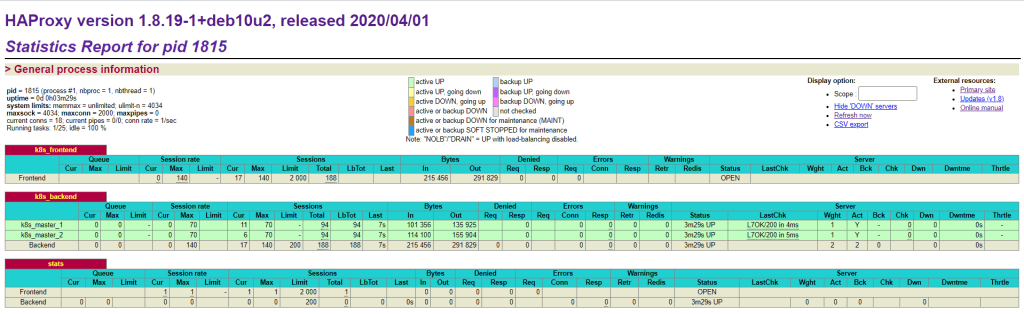
General Process Information
The general process information section provides an overview of the HAProxy process itself. Here are the key details from the provided screenshot:
-
Process ID (pid): 1815
-
Uptime: 0 days, 0 hours, 3 minutes, and 29 seconds
-
System Limits:
-
memmax: unlimited
-
ulimit-n: 4034
-
maxsock: 4034
-
maxconn: 2000
-
maxpipes: 0
-
Current Connections: 18
-
Current Pipes: 0/0
-
Connection Rate: 1 per second
-
Running Tasks: 1/25
-
Idle Tasks: 100%
This information helps in understanding the current state and configuration limits of the HAProxy instance.
Frontend Statistics: k8s_frontend
The frontend is the interface that accepts incoming client connections. Here's a breakdown of the k8s_frontend statistics:
-
Queue:
-
Current (Cur): 0
-
Maximum (Max): 0
-
Limit: 0
-
Session Rate:
-
Current (Cur): 0
-
Maximum (Max): 140
-
Limit: 2000
-
Total: 188
-
Sessions:
-
Load Balanced Total (LbTot): 0
-
Last: 17
-
Bytes:
-
In: 215,456
-
Out: 291,829
-
Denied:
-
Requests (Req): 0
-
Responses (Resp): 0
-
Errors:
-
Connections (Conn): 0
-
Responses (Resp): 0
-
Retries (Retr): 0
-
Redispatches (Redis): 0
-
Warnings: None
-
Status: OPEN
The frontend statistics show that there are no queued requests, the session rate is within limits, and there are no denied requests or errors, indicating a healthy frontend.
Backend Statistics: k8s_backend
The backend servers handle the actual processing of requests. Here's a detailed look at the k8s_backend statistics:
-
Queue:
-
Current (Cur): 0
-
Maximum (Max): 0
-
Limit: 0
-
Session Rate:
-
Current (Cur): 0
-
Maximum (Max): 140
-
Limit: 200
-
Total: 188
-
Sessions:
-
Load Balanced Total (LbTot): 188
-
Last: 7 seconds
-
Bytes:
-
In: 215,456
-
Out: 291,829
-
Denied:
-
Requests (Req): 0
-
Responses (Resp): 0
-
Errors:
-
Connections (Conn): 0
-
Responses (Resp): 0
-
Retries (Retr): 0
-
Redispatches (Redis): 0
-
Warnings: None
-
Status: UP
-
Server Check (LastChk): L7OK/200 in 4ms (for
k8s_master_1) and L7OK/200 in 5ms (fork8s_master_2)
The backend statistics show no issues with queue or session limits and no errors or denied requests. Both backend servers (k8s_master_1 and k8s_master_2) are UP and performing well with quick response times.
Summary
The HAProxy statistics report provides a wealth of information that can be used to monitor and troubleshoot the load balancer and backend servers. Key metrics such as session rates, bytes in and out, denied requests, errors, and server statuses give a clear picture of the system's health and performance. Regularly reviewing these statistics helps in maintaining a robust and efficient load balancing setup.
By understanding and leveraging these statistics, administrators can ensure high availability and reliability of their services, providing a seamless experience to end users.
For more detailed information, you can refer to the HAProxy documentation and the official website.
I hope this detailed overview helps in understanding the HAProxy statistics report. If you have any questions or need further clarification, feel free to leave a comment below!
Imported from rifaterdemsahin.com · 2024