OpenShift Alerts and Dashboard
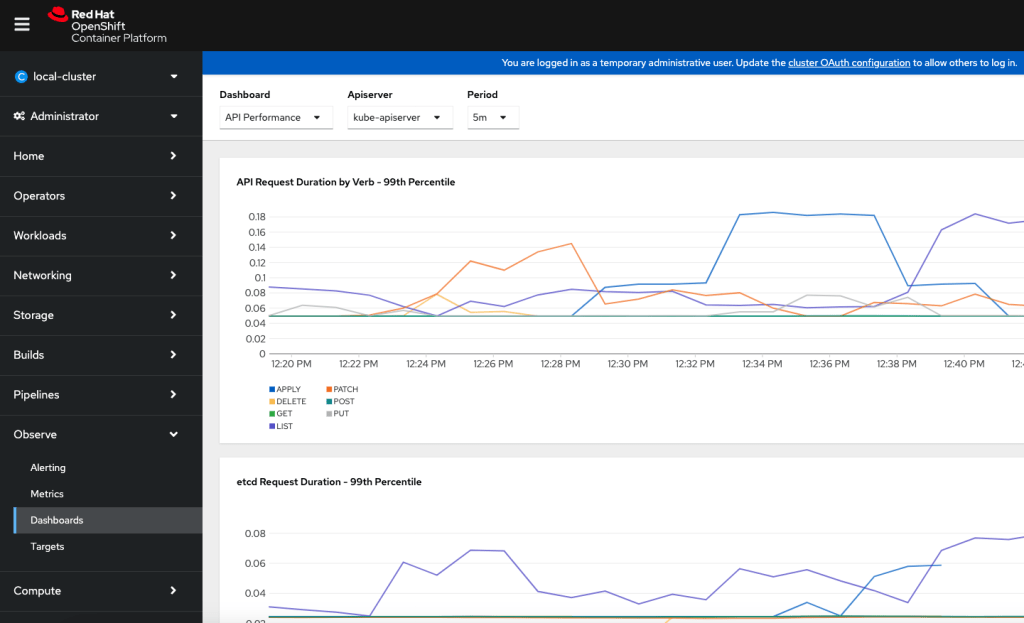
In the OpenShift environment, current alerts are primarily directed to the administrative console. The main challenge is to distinguish between useful alerts and background noise. Effective alert management ensures that critical issues are addressed promptly without being overwhelmed by irrelevant data.
Tools for Effective Alert Management:
-
Prometheus:
-
Purpose: Querying and monitoring metrics.
-
Benefit: Allows precise tracking and alerting based on specific metrics, helping to filter out noise and focus on actionable alerts.
-
Reference: Prometheus (software)
Cabana (ELK Stack) Log Management
The ELK Stack, comprising Elasticsearch, Logstash, and Kibana, provides robust log management capabilities. Structured logging in JSON format is a key feature that enhances log clarity and utility.
Key Dashboards:
-
Application Log Dashboard: Monitors application-specific logs.
-
Business Entity Dashboard: Focuses on logs relevant to specific business entities.
-
Istio Access Dashboard: Monitors access and interactions within the Istio service mesh.
Reference: ELK Stack
Grafana Dashboards
Grafana leverages data from OpenShift monitoring Prometheus and service mesh Prometheus to provide comprehensive dashboards.
Essential Dashboards:
-
Apps Dashboard: Monitors application performance and health.
-
DB Services Dashboard: Tracks database service metrics.
-
Module and Services Dashboard: Provides insights into various modules and services, ensuring their smooth operation.
Reference: Grafana
Imported from rifaterdemsahin.com · 2024